-
Update for Thursday, October 13th -- Crossroads
Overall, I think the markets are out of sync -- rationale is in my post here.
===========
Overall, the cumulative $TICK remains very strong:
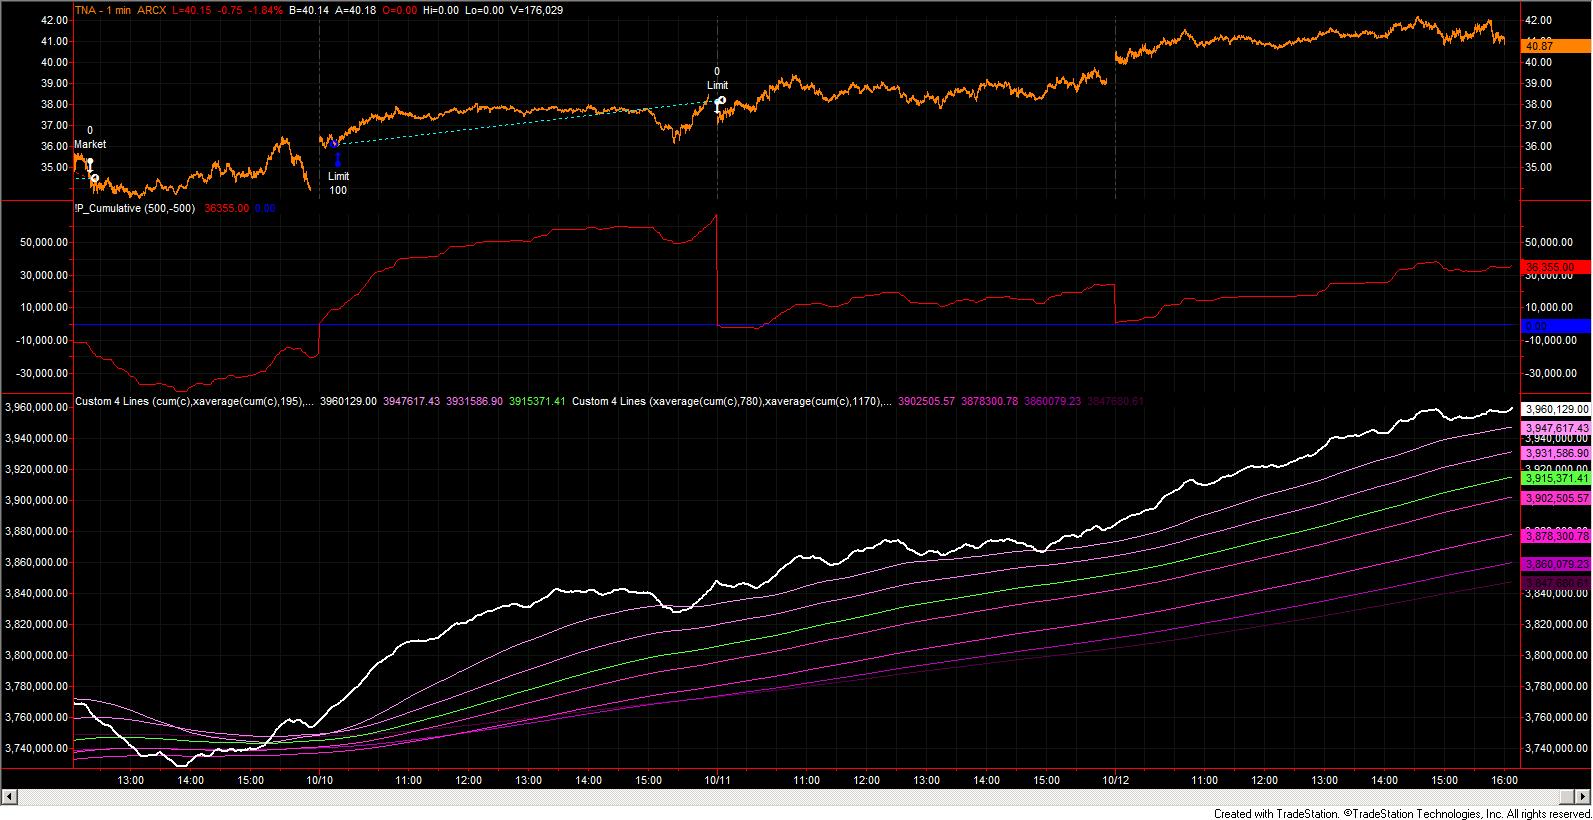
Note that:
1) the cumulative tick in the lower pane is constantly above all the moving averages
2) all the moving averages have a positive slope
3) all the moving averages are more-or-less constant-spaced, which means we do not have acceleration
I consider this an orderly movement upwards of the broader markets.
If we take a deeper dive into the SPX, R2K, and NDX, we see that the SPX is showing the most cumulative tick volatility, the R2K is less so but still volatile, and the NDX is impressively strong:
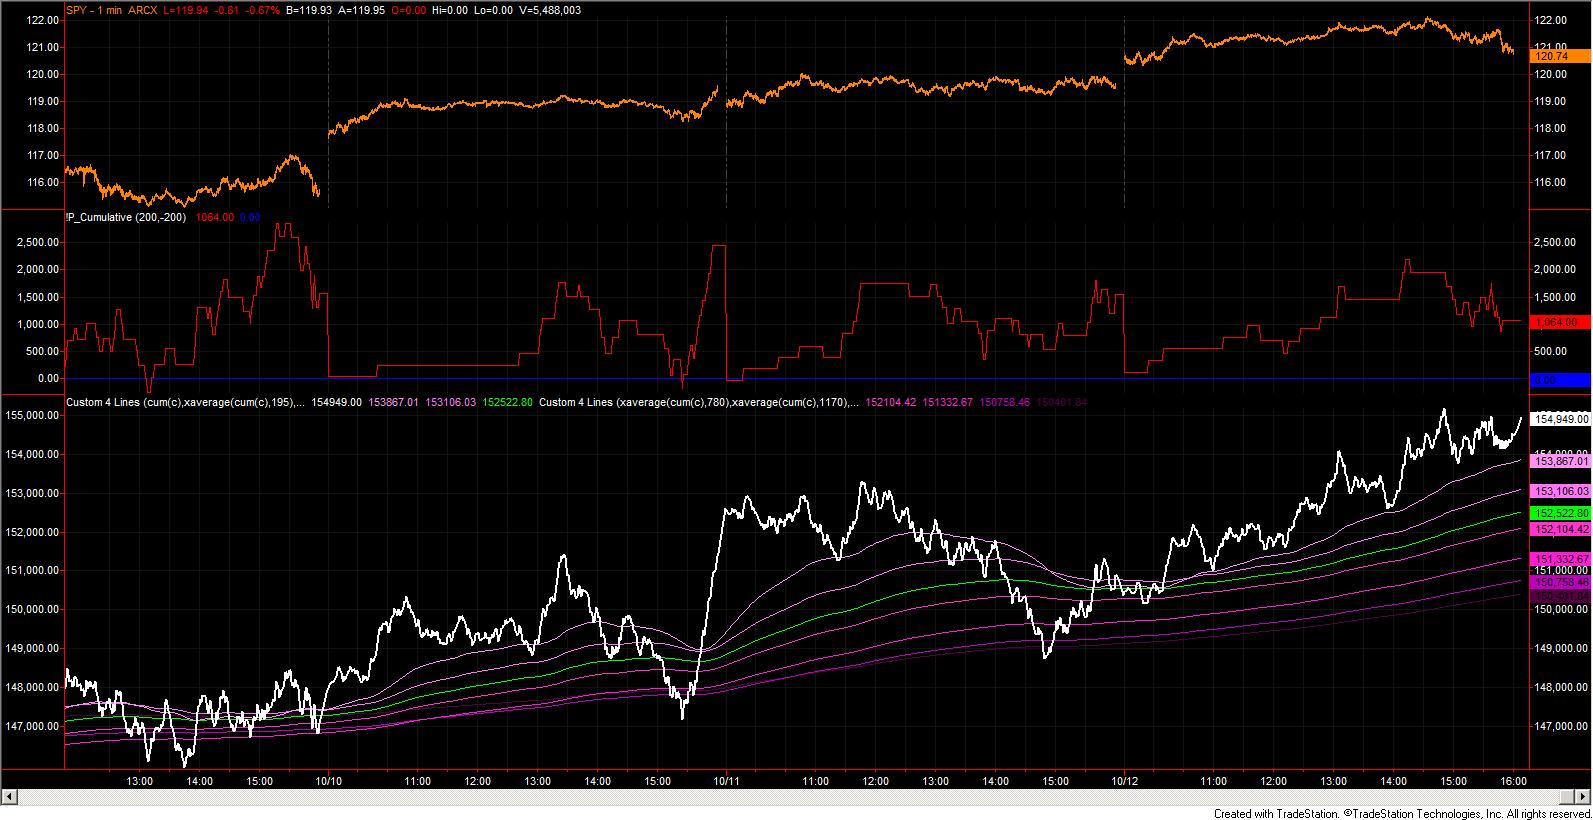
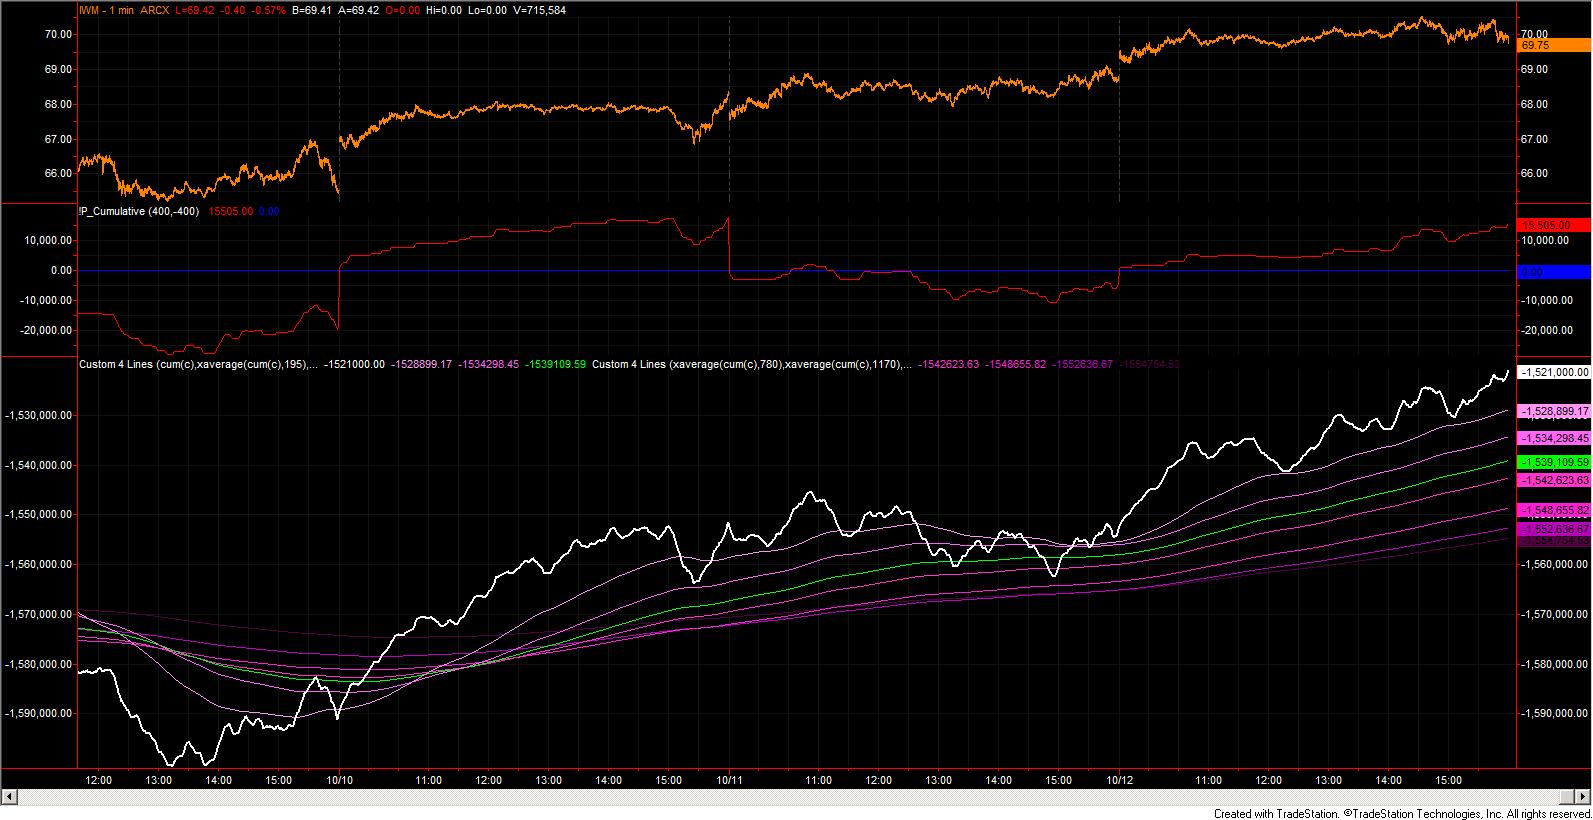
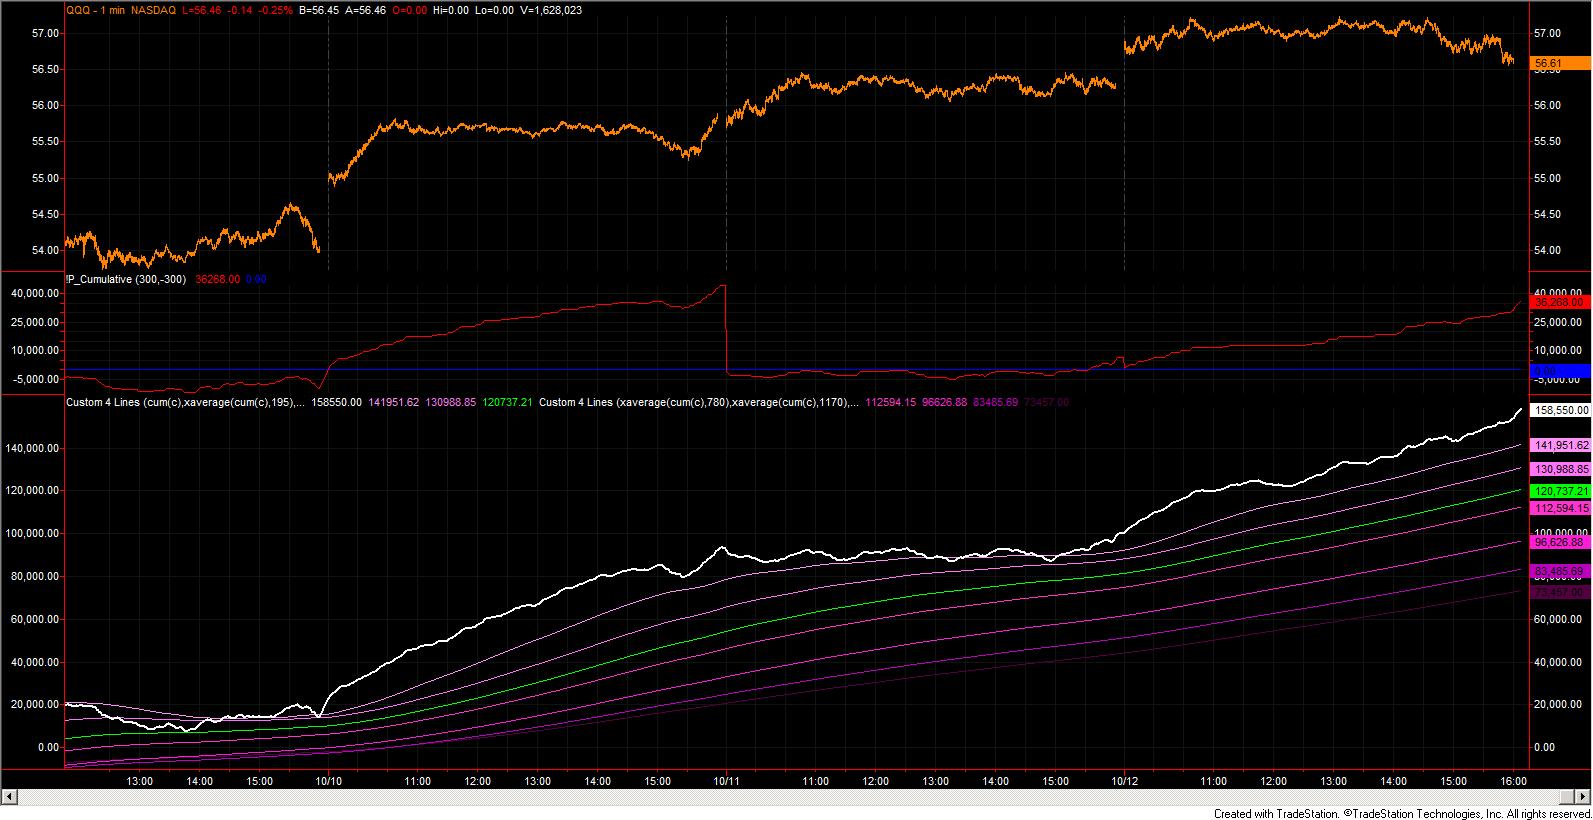
The SPX ($TIKSP) is on top, the R2K ($TIKRL) in the middle, and the NDX ($TIKND) on the bottom.
My view of what we're seeing here is a rotation from the SPX into the Russell and technology stocks, and this bodes well overall despite being very overbought at this level.
In my spare time (ha!) I have been working on strategies to trade these cumulative signals, and the most stable, longer-term in-sample/out-of-sample consistency appears to be using the cumulative $TICK as the primary market trending entity and entry signal, with additions and exits from those positions determined/confirmed by behavior on the individual cumulative $TIKXX indicators. The individual cumulative $TIKXX indicators are incredibly more sensitive to news events than the $TICK, but they do fare better than simply relying on the $TICK for exits. A further path for exploration here that I'm working on is to use the $TICK for confirmation of entry and using the individual security for timing the exit. This has worked better with the leveraged instruments than the unleveraged underlying.
More (and official results) to follow as time allows.
With respect to the above charts, even though we're clearly due for a pullback, today (Thursday) will be the first indicator of such a pullback according to the cume tick displays. Right now they are all indicating bullishness, so the depth of the pullback, e.g., does the real-time cume tick cross certain MAs, will determine whether we should remain bullish or start transitioning to a bearish stance. In the present displays, there really is no overwhelming bearishness...
===============
Regards,
pgd
 Posting Permissions
- You may not post new threads
- You may not post replies
- You may not post attachments
- You may not edit your posts
Forum Rules


 Reply With Quote