


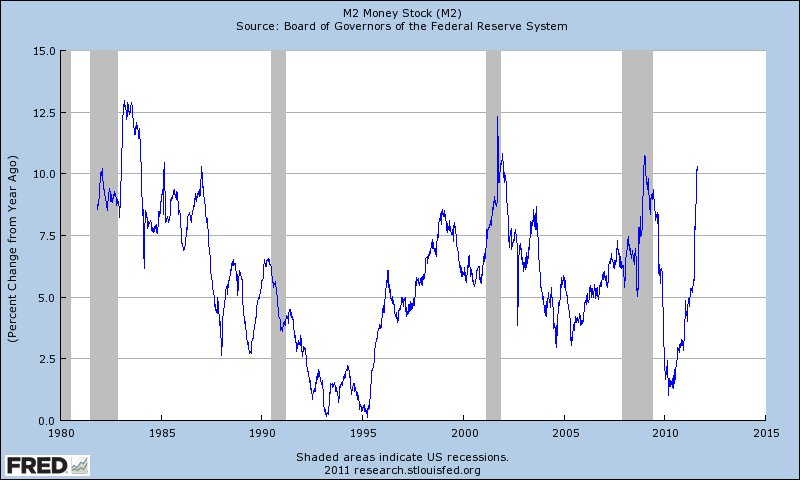
Money Supply continues to grow. Knee in curve is end of June when QE2 ended.
The last datapoint is August 29. This is Seasonally adjusted data. We will see an update soon, data gets recorded weekly closing on Monday's.


Money Supply continues to grow. Knee in curve is end of June when QE2 ended.
The last datapoint is August 29. This is Seasonally adjusted data. We will see an update soon, data gets recorded weekly closing on Monday's.
Mike Scott
Cloverdale, CA

Indeed. YoY, up 10%+.
Does anyone have (or know of) any studies showing a relationship between M2 growth or decline and S&P 500 performance?
Thanks.
Bob,
Is the Fed chart data in an Excel file one can access on their site?
You can build the chart here and download the data in CSV:Originally Posted by adam ali

http://research.stlouisfed.org/fred2/graph/
 Posting Permissions
 Reply With Quote