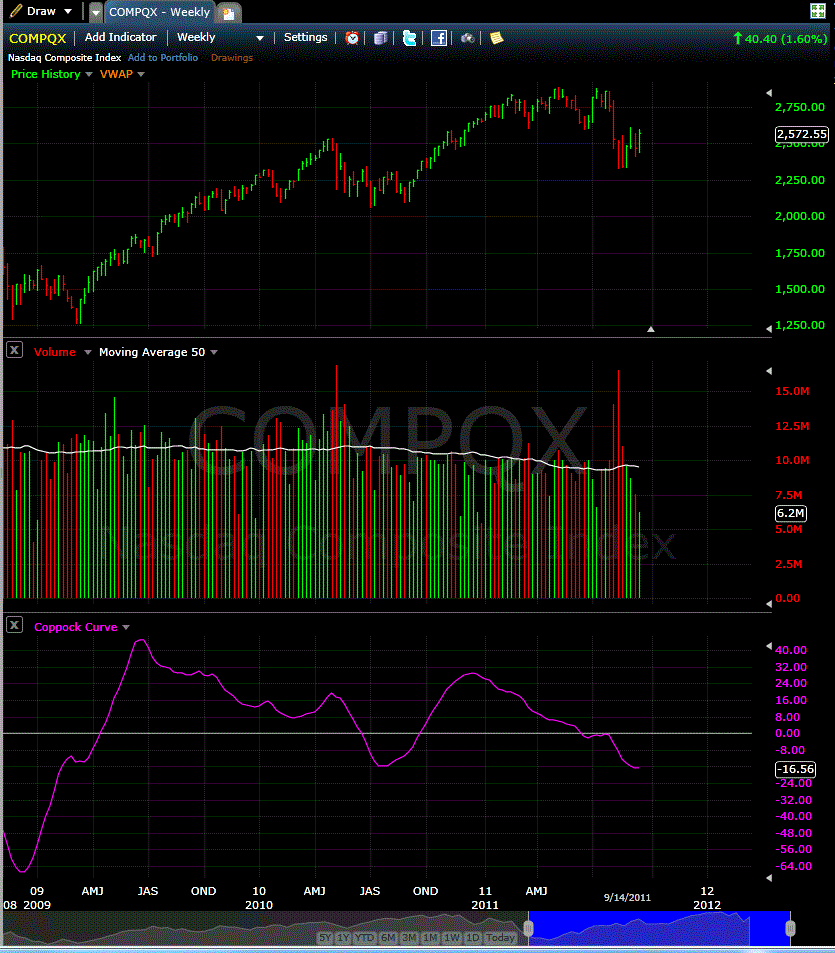
The NASDAQ Weekly Coppock could have bottomed. It depends on the Friday close.
In studies of past follow-through days a weekly coppock buy signal (closes up 1 point or more after a bottom below the zero line) that occurs within 20 trading days of the FTD are much more likely to produce a significant rally. Friay would mark 17 trading days since the 8-23 FTD. There is something about the dynamics of the curve that seems to match the need for the market to trade sideways after a significant drop before the market is ready to move up again. In short it seems to match the bottoming process well. The weekly time frame is shown here which matches subsequent rallys of at least 9 or 10 weeks or more in length. If you look at the monthly time frame I conclude that we are no where near putting in a bear market bottom. This could come middle of next year perhaps. So I conclude that we might be witnessing a tradeable bear market rally with knowledge that most bear market rallies tend to fail.
Below is the freestockcharts.com setup on the NASDAQ.

Mike Scott
Cloverdale, CA


 Reply With Quote