Forum Clusters 110823.xlsx
We didnít have to wait long for GDX to finally break decisively above SR1 and QR1 (62.12). This sets the stage up for a potential target to SR2 and QR2 (69.65). The only two floor resistances left before this target are WR3 (65.64) and MR2 (65.90), clustering together mid-way with a strength (7) less than half the one from the first support cluster (17). One could not dream of a better looking multi-pivot structure in favor of long positions. The robot could raise once again the trailing stop (58.53) just below its initial entry price of 58.96. This GDX trade really looks like another big winner in the making and should compensate for our patience with IWM.
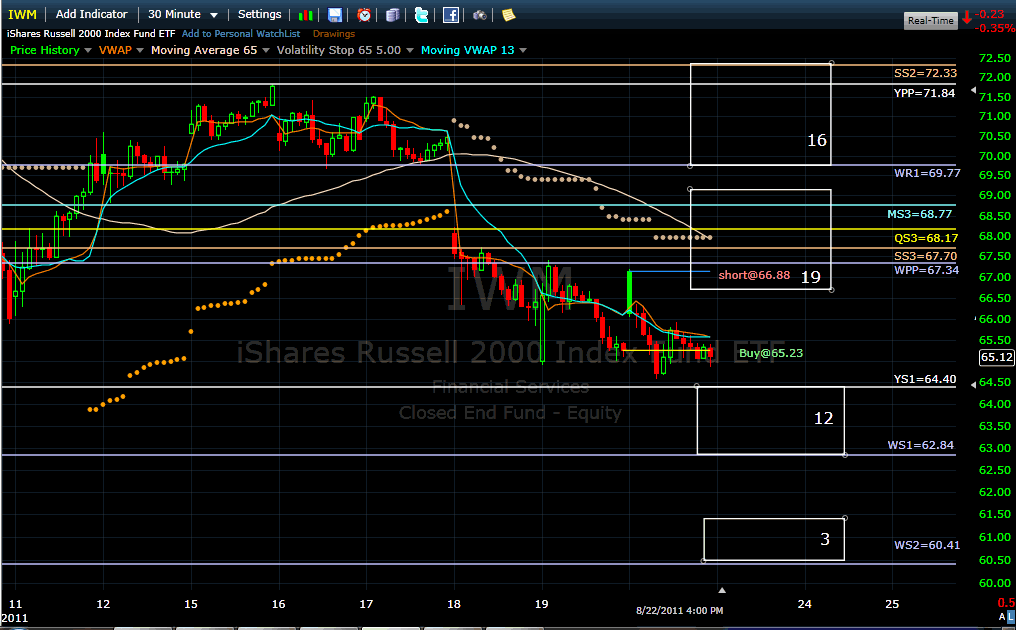
For IWM, there is nothing much that I can add to my recent comments, and the multi-pivots outlook is unchanged from yesterday. Anything can happen with equal probabilities and cash is king. The 20 DMF was flat yesterday, indicating lack of buying and selling pressure by large players. The cumulative TICK was strongly negative all day, indicating that HFT programs were biased to sell into strength. With the Jackson Hole speech on Friday, the whole week might look like a very long Fed Day where short term noise means nothing until the final announcement.
Billy


 Reply With Quote

