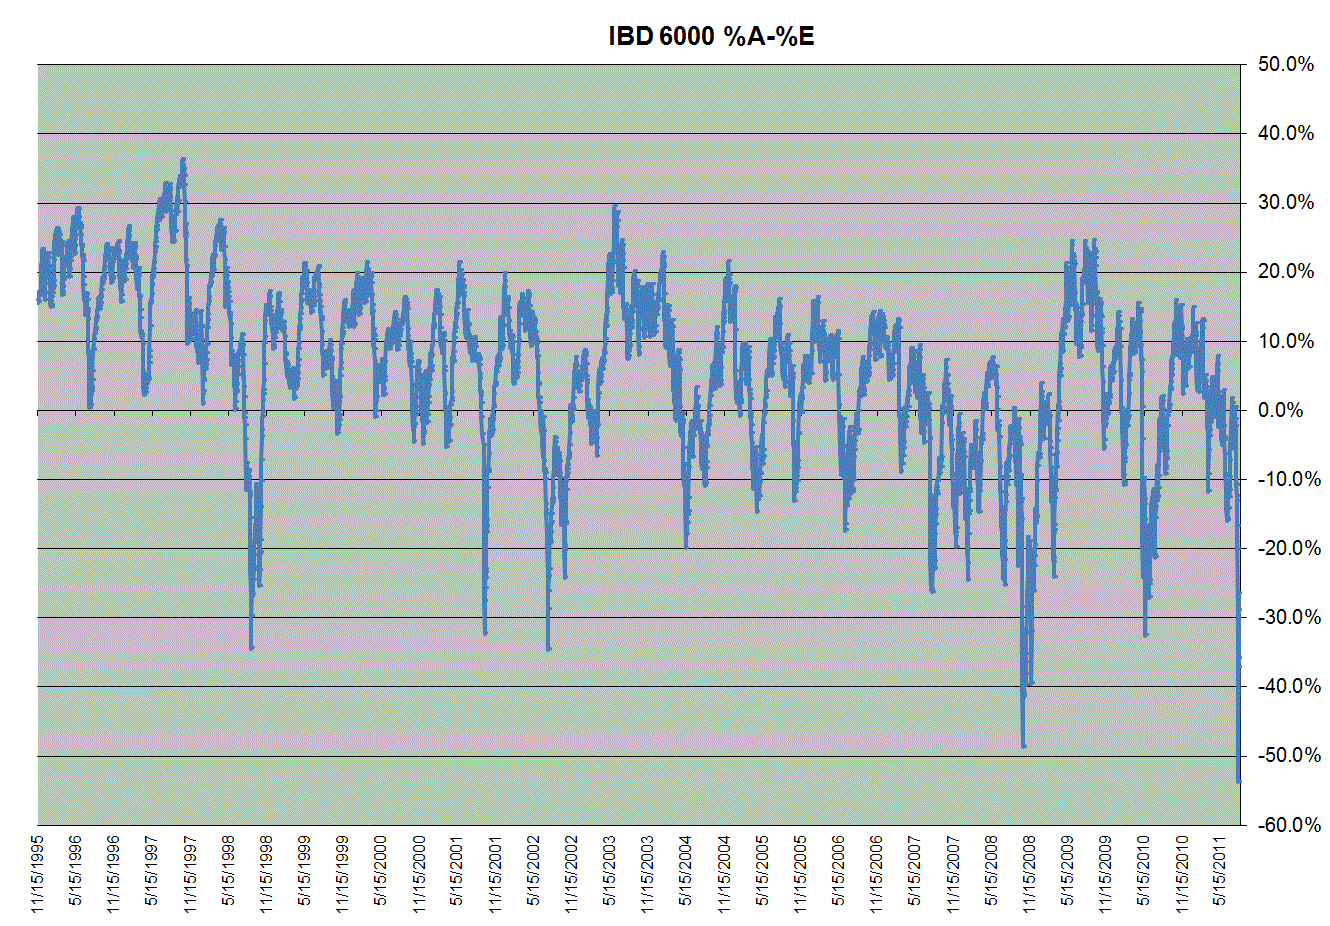
IBD6000 accumulation-distribution statistics
The recent sell off was of historical proportions, at least as far as the accumulation-distribution statistics in the IBD6000 index. This index is all stocks above $5 which right now is 5,463 stocks.
The chart is the percent of stocks showing A accumulation (high accumulation) minus the % of stocks showing E accumulation (high distribution). None of the very major sell offs such as 1998 and 2008 led to a deeper drop in this metric. If you inspected each of the major lows on this chart, none of them produced the ultimate bottom which always came later.
My conclusion is that any further rally will lead to a shorting opportunity sooner rather than later.
Mike Scott
Cloverdale, CA


 Reply With Quote