+ Reply to Thread
Page 1 of 2 1 2 LastLast
Results 1 to 10 of 12

Thread: Today is Death Cross Day – August 11, 2011

  1. #1
    Join Date
    Dec 1969
    Location
    Brussels, Belgium
    Posts
    1,999

    Today is Death Cross Day – August 11, 2011

    Forum Clusters 110811.xlsx

    The 50-day moving averages of IWM, SPY and QQQ are all expected to close today below their respective 200-day moving averages. Known as a “death cross” this signal is usually assimilated with very bearish conclusions for the long term trend. However, we have witnessed many times before that such an event coincided with the bottom of the first wave down in a major downtrend. A very good tradable rally often starts right from the “death cross” day leaving behind those who become too obsessed and paralyzed by the ominous cross. That’s why, although the 20 DMF still didn’t issue a buy signal after being poised to at 2:00 pm yesterday, any buy signal today or in the coming days might prove very powerful.

    This would also confirm that YS1 (64.40) was the low target area of the first wave down. Staying in cash allows us to calmly watch if that support around Monday’s lows holds. An intraday undercut down to WS2 (62.66) seems the maximal floor extension acceptable to avoid a total panic crash. There are simply no significant floor supports left below to build a credible multi-pivot strategy in case of a further freefall below YS1.

    Name:  iwm110811.gif
Views: 629
Size:  46.9 KB

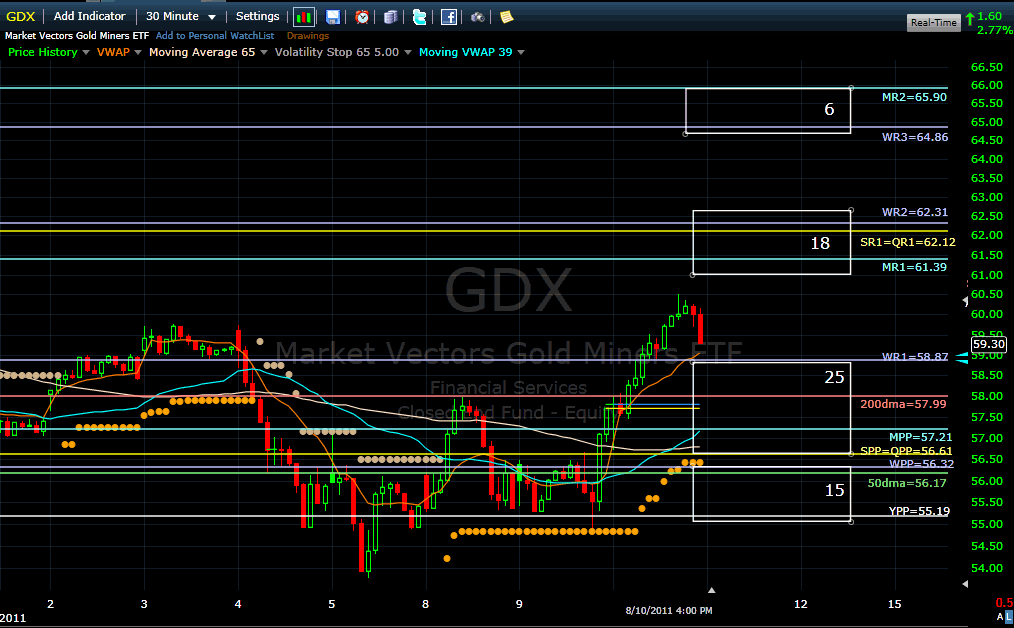
    In contrast, today’s buy signal at the open on GDX has a wonderful multi-pivot setup, with a very strong first support cluster (strength = 25) and moderate first resistance cluster (strength = 18). The total floor resistance clusters with strength of (18 + 6) 24 compared to total floor support clusters with strength of (25 +15 ) 40 suggest that floor traders and market makers will be supporting momentum to the upside, barring any adverse news.
    Billy

    Name:  gdx110811.gif
Views: 402
Size:  43.4 KB
    Last edited by Billy; 08-11-2011 at 08:31 AM.

  2. #2
    Billy,

    Could you put up the SPY chart, if possible - thanks.

  3. #3
    Join Date
    Dec 1969
    Location
    Long Island, New York
    Posts
    515

    If you filter out the dollar noise...

    Billy,

    Two weeks ago I posted that we had hit the death cross in real value (not nominal value) on the S&P and pointed out a likely decline.

    I posted the link, but here it is again:

    http://stockcharts.com/h-sc/ui?s=%24spx%3Audn

    You'll see that the decline happened a couple of days later.

    I still got caught with my pants down because I wasn't using my own advice... but it was a lesson learned.

    Basically all the dollar gyrations create false signals, and dividing the S&P by the inverse of the dollar ($SPX:UDN on stockcharts) filters out the noise and gives a truer signal.

    Tim

  4. #4
    Join Date
    Dec 1969
    Location
    Brussels, Belgium
    Posts
    1,999
    Quote Originally Posted by adam ali View Post
    Billy,

    Could you put up the SPY chart, if possible - thanks.
    Here are the SPY and QQQ charts.
    SPY's floor outlook is very similar to IWM, with YS1 as ultimate support.
    QQQ's low target is YPP.
    Billy

    Name:  spy110811.gif
Views: 395
Size:  47.0 KB
    Name:  qqq110811.gif
Views: 341
Size:  45.2 KB

  5. #5
    Join Date
    Dec 1969
    Location
    Brussels, Belgium
    Posts
    1,999
    Quote Originally Posted by Timothy Clontz View Post
    Billy,

    Two weeks ago I posted that we had hit the death cross in real value (not nominal value) on the S&P and pointed out a likely decline.

    I posted the link, but here it is again:

    http://stockcharts.com/h-sc/ui?s=%24spx%3Audn

    You'll see that the decline happened a couple of days later.

    I still got caught with my pants down because I wasn't using my own advice... but it was a lesson learned.

    Basically all the dollar gyrations create false signals, and dividing the S&P by the inverse of the dollar ($SPX:UDN on stockcharts) filters out the noise and gives a truer signal.

    Tim
    Thank you Tim,
    You certainly deserve to be credited with this one. Do you have any study or backtests of previous old signals?
    Billy

  6. #6
    Quote Originally Posted by Billy View Post
    Attachment 9796

    The 50-day moving averages of IWM, SPY and QQQ are all expected to close today below their respective 200-day moving averages. Known as a “death cross” this signal is usually assimilated with very bearish conclusions for the long term trend. However, we have witnessed many times before that such an event coincided with the bottom of the first wave down in a major downtrend. A very good tradable rally often starts right from the “death cross” day leaving behind those who become too obsessed and paralyzed by the ominous cross. That’s why, although the 20 DMF still didn’t issue a buy signal after being poised to at 2:00 pm yesterday, any buy signal today or in the coming days might prove very powerful.

    This would also confirm that YS1 (64.40) was the low target area of the first wave down. Staying in cash allows us to calmly watch if that support around Monday’s lows holds. An intraday undercut down to WS2 (62.66) seems the maximal floor extension acceptable to avoid a total panic crash. There are simply no significant floor supports left below to build a credible multi-pivot strategy in case of a further freefall below YS1.

    Attachment 9795

    In contrast, today’s buy signal at the open on GDX has a wonderful multi-pivot setup, with a very strong first support cluster (strength = 25) and moderate first resistance cluster (strength = 10). The total floor resistance clusters with strength of (10 + 6) 16 compared to total floor support clusters with strength of (25 +15 ) 40 suggest that floor traders and market makers will be supporting momentum to the upside, barring any adverse news.
    Billy

    Attachment 9794
    Billy,

    Looking at your Excel page the First Resistance cluster for GDX is 18 is it not ? (You mentioned 10 above).

    Trev

  7. #7
    Join Date
    Dec 1969
    Location
    Brussels, Belgium
    Posts
    1,999
    Quote Originally Posted by manucastle View Post
    Billy,

    Looking at your Excel page the First Resistance cluster for GDX is 18 is it not ? (You mentioned 10 above).

    Trev
    Trev, you are correct. When I told you that I had eyesight problems!.
    I will edit now the chart and text of the initial post.
    Thank you,
    Billy

  8. #8
    Billy, great call on today's action. Would the YPP on the SPY be a logical place for this rally to stop today?

  9. #9
    Join Date
    Dec 1969
    Location
    Brussels, Belgium
    Posts
    1,999
    Quote Originally Posted by adam ali View Post
    Billy, great call on today's action. Would the YPP on the SPY be a logical place for this rally to stop today?
    Yes, and a dangerous place to be long now, just below a strong cluster + the volatility stop and above a declining 5-day moving average.
    Billy

    Name:  spyaa.gif
Views: 356
Size:  49.7 KB

  10. #10
    Death crosses and golden crosses are pretty widely followed. I wonder if that's why they don't seem to be so effective anymore. Anyway, we might have successfully tested the neckline on this large monthly inverse H&S for the Nasdaq.
    Attached Images  

+ Reply to Thread

Posting Permissions

  • You may not post new threads
  • You may not post replies
  • You may not post attachments
  • You may not edit your posts