+ Reply to Thread
Page 1 of 3 1 3 LastLast
Results 1 to 10 of 22

Thread: Auto-Pilot Disengaged – August 8, 2011

  1. #1
    Join Date
    Dec 1969
    Location
    Brussels, Belgium
    Posts
    1,999

    Auto-Pilot Disengaged – August 8, 2011

    Name:  ap.jpg
Views: 4677
Size:  55.1 KBName:  cash-king.gif
Views: 4722
Size:  63.5 KB

    Forum Clusters 110808.xlsx

    The IWM Robot is now totally out of any reasonable and reliable historical statistics samples available. There is no way we can allow to put our capital at risk based on blind following of the contradictory ST/LT signals, especially in presence of a dangerous exponentially expanding volatility.

    Consequently, Pascal and I jointly decided to switch-off the auto-pilot and to leave the robot in cash until further notice. Starting on Monday, statistics will be published as usual on the robot page, but the signal will be to stay in cash whatever the apparent edges. Dark clouds and storms abound ahead of the market and the traffic controllers are blocking all passengers on the tarmac for survival and safety reasons.

    Not only is the robot out of statistical bounds, but more ominously, the 20 DMF itself is now in unknown territory. Pascal will comment on how one can try to pilot “manually” a plane under such conditions with the various tools from the EV website.

    My own view is that it is crazy and pure gambling to even try boarding any plane now. Do you remember the old discussion we had about the “Holy Grail of Trading” actually being patient and taking only the highest probability setups? Now is the time to relax in cash until reliable strong edges are back in play and everybody else end up ruined, depressed and exhausted.

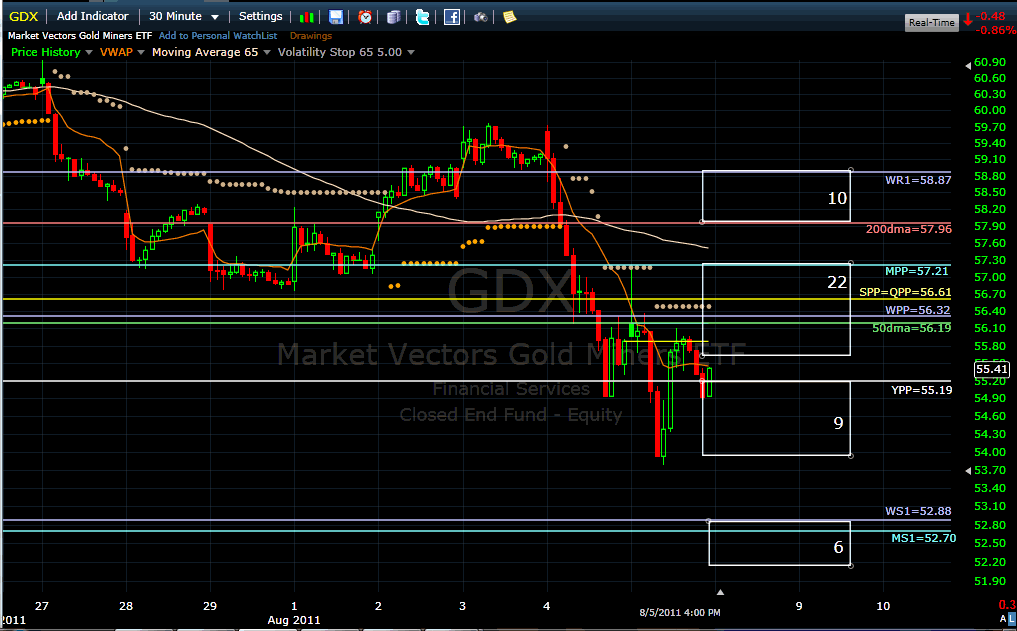
    Below are the multi-pivots charts of IWM, SPY, QQQ and GDX for your review. They currently all require no other commentary than that Yearly Pivot (YPP) is the key support/resistance and equilibrium for all of them. With the exception of a neutral SPY, they are all under heavy floor selling pressure from the resistance clusters.
    Billy

    Name:  iwm110808.gif
Views: 4658
Size:  42.7 KB
    Name:  qqq110808.gif
Views: 4655
Size:  42.4 KB
    Name:  gdx110808.gif
Views: 4688
Size:  43.1 KB
    Attached Images  

  2. #2
    Quote Originally Posted by Billy View Post
    Attachment 9707Attachment 9705

    Attachment 9706

    The IWM Robot is now totally out of any reasonable and reliable historical statistics samples available. There is no way we can allow to put our capital at risk based on blind following of the contradictory ST/LT signals, especially in presence of a dangerous exponentially expanding volatility.

    Consequently, Pascal and I jointly decided to switch-off the auto-pilot and to leave the robot in cash until further notice. Starting on Monday, statistics will be published as usual on the robot page, but the signal will be to stay in cash whatever the apparent edges. Dark clouds and storms abound ahead of the market and the traffic controllers are blocking all passengers on the tarmac for survival and safety reasons.

    Not only is the robot out of statistical bounds, but more ominously, the 20 DMF itself is now in unknown territory. Pascal will comment on how one can try to pilot “manually” a plane under such conditions with the various tools from the EV website.

    My own view is that it is crazy and pure gambling to even try boarding any plane now. Do you remember the old discussion we had about the “Holy Grail of Trading” actually being patient and taking only the highest probability setups? Now is the time to relax in cash until reliable strong edges are back in play and everybody else end up ruined, depressed and exhausted.

    Below are the multi-pivots charts of IWM, SPY, QQQ and GDX for your review. They currently all require no other commentary than that Yearly Pivot (YPP) is the key support/resistance and equilibrium for all of them. With the exception of a neutral SPY, they are all under heavy floor selling pressure from the resistance clusters.
    Billy

    Attachment 9703
    Attachment 9708
    Attachment 9709
    Billy and Pascal,

    May I be the first to say thank you for this black and white guidance. Worth every penny of my subscription costs. I am safely in cash and will remain so for however long. (Apart from a very small amount of cash for daytrading to keep me awake and alert) !

    Trev

  3. #3
    Pascal and Billy,

    I would be VERY interested to understand how the trading patterns of 2011 differ statistically from those of 2008. Without any analysis to back this up, my gut feel says the markets were extremely chaotic back then just as they are now. How did the Robots react to price discovery back then and why?

  4. #4
    Join Date
    Jan 1970
    Location
    New York, NY
    Posts
    191

    Thanks Billy and Pascal

    For what it is worth -- I totally agree with you Billy. This is no robot time or even (swing)trading time. Wait on the sideline with a Margarita is the best we can do.
    My signal to re-enter is a hourly VIX in a down trend. You will see the vix starting to make lower hourly highs (over the coarse of several days!!!), that for me is the signal to seriously start looking for a long entry and for short vega trades.

    Anything till then is done in small size with the mindset of a day trader.

  5. #5
    Join Date
    Dec 1969
    Location
    Brussels, Belgium
    Posts
    1,999
    Quote Originally Posted by adam ali View Post
    Pascal and Billy,

    I would be VERY interested to understand how the trading patterns of 2011 differ statistically from those of 2008. Without any analysis to back this up, my gut feel says the markets were extremely chaotic back then just as they are now. How did the Robots react to price discovery back then and why?
    Adam,

    This is at the source of the statistical reliability problem. The 20 DMF was in confirmed shorting mode during all of September 2008 and had its first market direction signal change with a cover your short/buy signal on October 10, 2008. The robot did manage the trade well because it was looking for short positions durring all of that time Currently, the 20 DMF is already in unprecedented oversold territory and waiting for a long signal. Under such circumstances, the robot decides independently of the 20 DMF, and based on ST/LT statistics, whether to go long or short. But because the database only has a very few ST/LT combinations similar to today's, this is the exception to the rule that should be applied instead.
    We are also in a typical volatility expansion environment that can quickly lead to 5-6% daily intraday moves for IWM. Because the robot is an EOD system and the risk management is based on a rising but lagging ATR% of +/-3% daily volatility, any setup coul actually proved to be a winner EOD but would probably be stopped out many times during the day.
    Billy

  6. #6
    Join Date
    Dec 1969
    Location
    Beirut and Montreal
    Posts
    9
    billy

    could the Robot be adjusted further to include day trading setups, I mean, the wild swings in this market is a day trader dream (60+ points) ?, or is it just designed with EOD data only and is not capable of intra daily data ??.
    thank you

  7. #7
    Join Date
    Dec 1969
    Location
    Brussels, Belgium
    Posts
    1,999
    Quote Originally Posted by hmatar View Post
    billy

    could the Robot be adjusted further to include day trading setups, I mean, the wild swings in this market is a day trader dream (60+ points) ?, or is it just designed with EOD data only and is not capable of intra daily data ??.
    thank you
    Hmatar,
    Experienced discretionary day traders are the only ones who can expect to make a good performance and they are the only ones who should be hyperactive instead. I confess that I will try to be in that camp too.
    An intraday robot can only be developped with the availibilty of a real-time 20 DMF which is still under development. It is an extraordinary technical challenge to finalize due to the millions of data to process and repeat every minute.
    Billiy

  8. #8
    Join Date
    Dec 1969
    Location
    Beirut and Montreal
    Posts
    9
    thank you billy, looking forward already for intraday Robot, hope you guys can handle the ton of data and able to produce such a gold mine...good luck

  9. #9
    Join Date
    May 2011
    Location
    South Florida
    Posts
    51
    Quote Originally Posted by Billy View Post
    Adam,

    This is at the source of the statistical reliability problem. The 20 DMF was in confirmed shorting mode during all of September 2008 and had its first market direction signal change with a cover your short/buy signal on October 10, 2008. The robot did manage the trade well because it was looking for short positions durring all of that time Currently, the 20 DMF is already in unprecedented oversold territory and waiting for a long signal. Under such circumstances, the robot decides independently of the 20 DMF, and based on ST/LT statistics, whether to go long or short. But because the database only has a very few ST/LT combinations similar to today's, this is the exception to the rule that should be applied instead.
    Billy
    Billy, I'm copying my recent comment to the analogy made by Ivan Hoff on another thread:

    Quote Originally Posted by TraderD View Post
    I'm somewhat puzzled by the analogy. The robot reportedly cruised fine through the Fall of 2008 and didn't have to go to cash every night. Why is there a manual override now? Is this possibly a symptom of an over-optimized trading system (relative to available backtest/analysis historical data)?
    Trader D
    The rather simple-minded observation I have (admittedly, in complete hindsight) is that if the robot didn't include the ETF confirmation criterion (in its specific incarnation), we would be now in a rather impressive short swing trade and AFAICT a manual override into cash wouldn't happen, is that correct? If that is indeed the case, wouldn't you be inclined to think that the ETF confirmation is an over-optimized component of the robot? Would it make sense to go back and reduce the number of parameters tweaked in the robot setup to achieve greater consistency at the likely expense of lower overall return?

    Trader D

  10. #10
    Billy and Pascal,

    Back in fall of 2008, the 20DMF issued a sell signal. Am I correct in understanding that signal didn't require confirmation from the inverse ETFs, which only came into play when the Fed entered the market through its POMO?

    Also, in October 2008, the 20DMF gave a buy signal. In between the time it was short and then long, did the 20DMF fall into the pattern we're experiencing today, i.e., deeply oversold but not yet in buy mode? In other words, was it in cash?

    If so, then the Robot backtest would have the Robot seeking a trade based solely on the LT/ST stats. Are those stats quite different than what we're seeing today? Did the Robots seek trades then or was it in cash?

    I do understand and agree that relying on relatively few data points to trade the Robot makes no sense. My questions are more to gain a greater perspective on the contrast between 2008 and now in terms of the EV system.

+ Reply to Thread

Posting Permissions

  • You may not post new threads
  • You may not post replies
  • You may not post attachments
  • You may not edit your posts