P&F Tutorial Horizonatal Count Price Targets
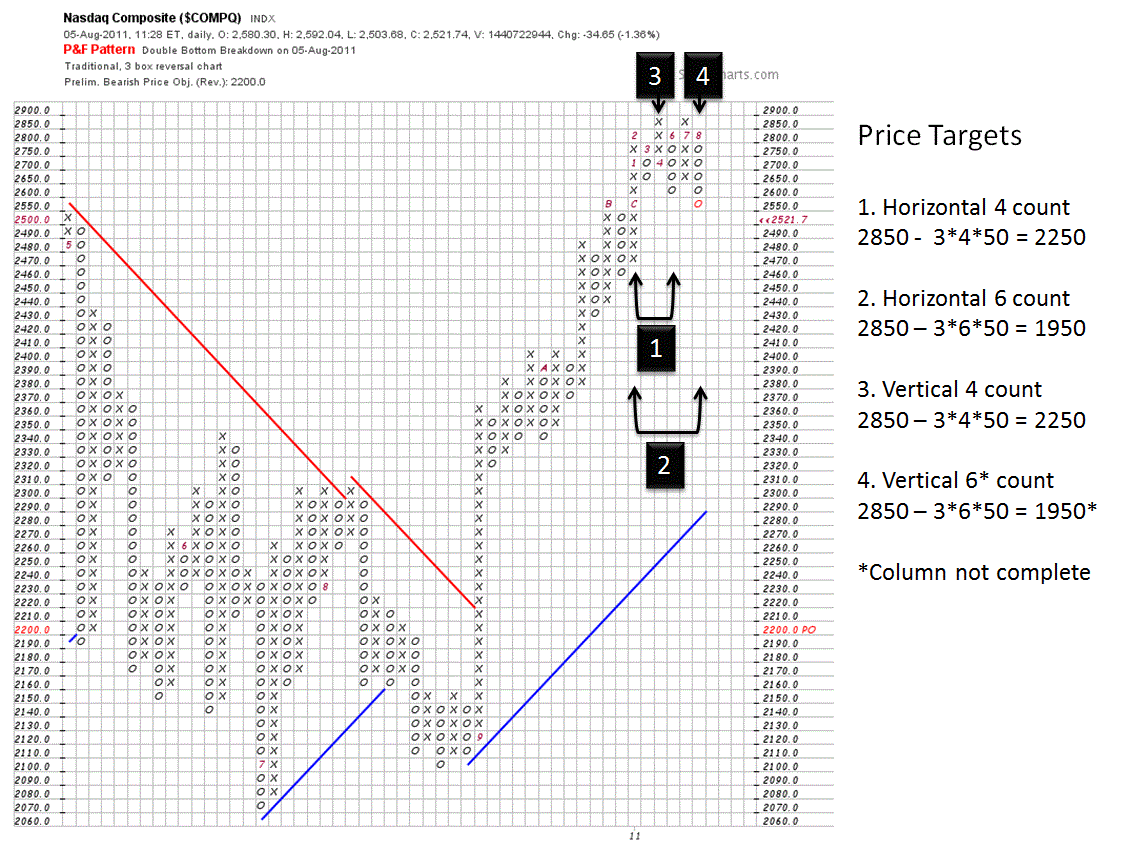
The chart shows the NASDAQ 3 box reversal P&F chart snapshot taken earlier this morning. We made a new double-bottom sell signal today. The combination of this and the prior double bottom sell signal in June completes a what is called a bearish catapult. Marked on the chart are the four possible price target calculations based on this topping pattern.
Price Target #4 is incomplete as the column of O's is still possibly building.
I explained vertical count targets yesterday. Targets 3 and 4 are vertical counts using the technique explained in that post. Targets 1 and 2 are horizontal count targets. The rule is to count the width of the pattern (number of boxes) that exist between a column of X's and a subsequent column of O's (for a topping pattern). The columns would be reversed for bottoming patterns.
The calculation is the same as vertical counting except substituting the width of the pattern for the height of the column in the vertical count. The implications of the counts to the point developed in this chart is that we are probably in for a bear market correction of approximatele 22-32%.
Late breaking news, as the NASDAQ continued to sell off after clipping this chart the vertical count for the #4 target is growing and this will lead to a lower target. I just checked the current chart and a new lower low target of 1710 is now computed for a 41% bear marlet correction. This would be a 73% retracement of the move from 2009 lows. The problem is that the column of O's is still growing and there is no telling when the column will complete.
Mike Scott
Cloverdale, CA


 Reply With Quote

