Market Comment 7-28-11
IBD put the market in correction after yesterday's carnage. Jerry's leaders index and the Dow Transports have been predicting weakness for a while now. Yesterday's action was probably an over reaction to news and any relief to the news will probably be greeted with a pop upwards in the market.
I have been mentioning the stair stepping upward ATR of the NASDAQ and that this is consistent with a major market top.
We have seen three distribution days in a row. Historically this has stopped most rallies in their tracks. We have seen 6 distribution days over the last 20 days on the S&P500, Dow, Russell 2000, and NASDAQ and seven distribution days over 20 days on the NYSE composite. This is a significant load of distribution and a level consistent with a market top.
Leading stocks since the 2009 bottom have mostly formed late stage base structures and many are failing. This is consistent with a major market top.
Looking at the 100-year plus history of the market during periods of secular consolidations that follow major bubble markets (2000) has been pointing for at least six months that we are at levels that are consistent with significant downside risk and limited upside opportunity as the rally has pushed up toward consolidtion resistance levels. Resistance levels are porous so upside activity can happen.
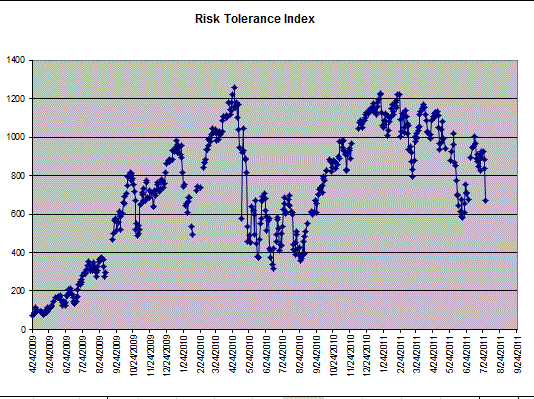
I run a simple screen every morning that I call Risk Tolerance Index. It is simple in that it counts the number of stocks in the IBD 6000 index with PE > 20 and trading within 15% of a 52-week high. A large appetite for these kinds of stocks indicate to me that institutions have a rosy view of the future in growth stocks. This index peaked on January 14 of this year and has been stair stepping lower. Institutions have been systematically reducing their holdings in high flying growth stocks. I attach the image of this index below. This chart covers the entire bull market from near the 2009 lows.
In my contrarian view that I posted some time ago the low road is still possibly in play, if not probably the road we are on. The evidence has been building since January that a major market top is being built. Market tops are broad and seldom can we pick the absolute top. There is room for the market to make a last leg upwards or there is room for the market to just fizzle right here.

Mike Scott
Cloverdale, CA


 Reply With Quote