Forum Clusters 110721.xlsx
The most negative floor influence weighing on the overall market is coming from QQQ reversing right at its YR1 (59.02) and with very light support down to Monday’s close, suggesting a filling of Tuesday’s gap might be looming ahead.
IWM has an almost inverse cluster structure, sitting on strong support and facing light resistance. But it was unable so far to break last week’s highs and is lagging much behind QQQ. The 20 DMF fell modestly yesterday and large players need to buy today’s expected gap down to avoid a new short signal threshold zone alert. If earnings season started mostly with large cap stocks reports, today is the first day with many small cap stocks belonging to the Russell 2000 reporting before and after the day’s cash session. In case of good reactions to the reports, IWM may start to outperform from here. In case of negative reactions (like with RVBD yesterday), funds will likely have all the best reasons to remain patient with their buy programs at least until the turn of the month. In such a case, and barring any sell signal, it is important that IWM doesn’t weaken more than necessary to fill Tuesday’s gap, right at the lower limit of the strong support confluences and bounces thereafter for a new consolidation between MPP (81.62) and WPP (83.13). On the other hand, if all turns out fine, IWM remains within an easy reach of YR1 (85.68) due to the lack of serious resistance.
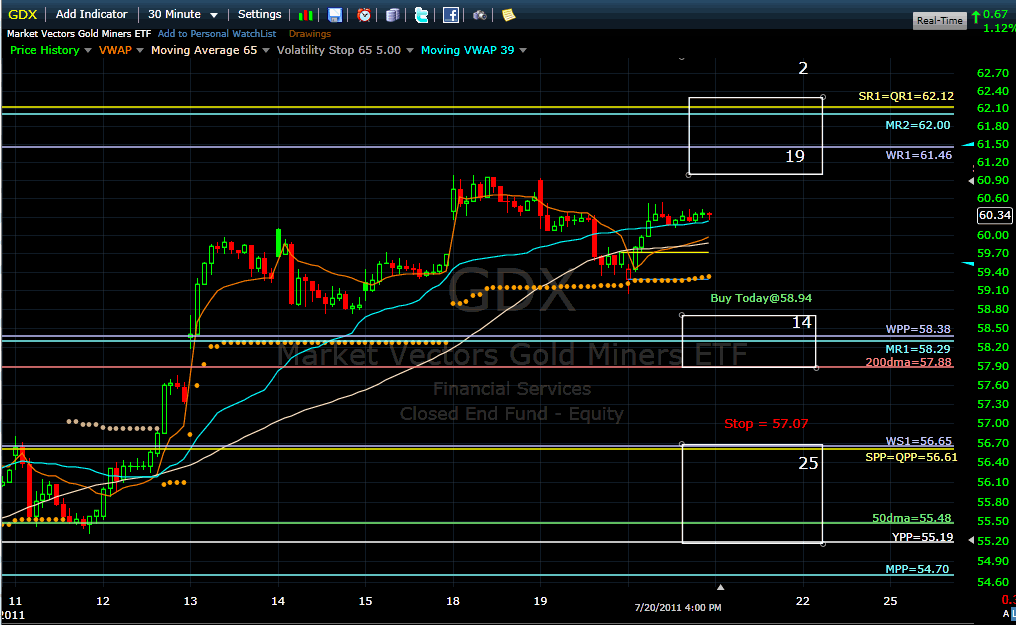
The outlook remains good for GDX and it acted exactly like we desired by closing above the rising 5-day moving average after a small intraday dip that missed the day’s entry limit by a few cents. Billy


 Reply With Quote
