


Thanks very much EB .Originally Posted by EB

Trev

Thanks very much EB .
Trev
EB,
I have this up and running and it is VERY useful.
Also useful is using this with $TIKRL which is the Russell 2000 Tick index which is possibly very useful for IWM.
Trev
Hi.
The problem's not with getting $TICK. The problem was getting identical settings. Thanks anyway, though. I'm going to sign up for Stockcharts or Tradestation, and if I ever figure out how to get the settings on ToS I'll post it.
Thanks to all who posted instructions.
Perhaps I'm in the same boat: playing catch up with indicators and terminology. Let me know what you might find.
Thanks...
If all subscribers to stockcharts.com and those interested would kindly go to
http://stockcharts.com/help/doku.php...symbol_request
Please ask them to add the tick chart for the Russell 2000, symbol $TIKRL.
I believe this would be very helpful to our IWM robot community.
Thanks, Dave
Stockcharts answer regarding the R2K Tick,
Cole Johnson, Jul-23 23:03 (PDT):
Dear David,
Thanks for sending me that additional information. I see where the confusion has occurred. The term "Tick chart" has a more common meaning that is different from the way you are using it.
While $TICK and $TICKQ can be called "Tick" charts because of their names, they are not "tick charts" in the traditional sense of that phrase. A "tick chart" is a very short-term chart where the horizontal axis represents each trade that happened while the market was open.
http://daytrading.about.com/od/daytr...TickCharts.htm
$TICK and $TICKQ are _market_indexes_ that show the number of stocks that are increasing ("ticking up") minus the number of stocks that are decreasing ("ticking down"). $TICK is calculated and published by the NYSE. $TICKQ is calculated and published by the Nasdaq.
We do not have access to data for the Russell 2000 version of $TICK. I see that TIKRL appears to only be provided by TradeStation because it appears to be a proprietary calculation that they do themselves. We do not have ability and must rely on data provided by our data vendor.
Thanks again for using StockCharts.com,
Cole Johnson
StockCharts Support
http://stockcharts.com
I guess $TIKRL, is not available on stockcharts.com, which is unfortunate. I only see $TICK and $TICKQ. Perhaps I will ask stockcharts.com if they will add the symbol. Dave

Excellent initiative, Dave. I propose that all interested do the same; a massive demand has much more impact!
Billy

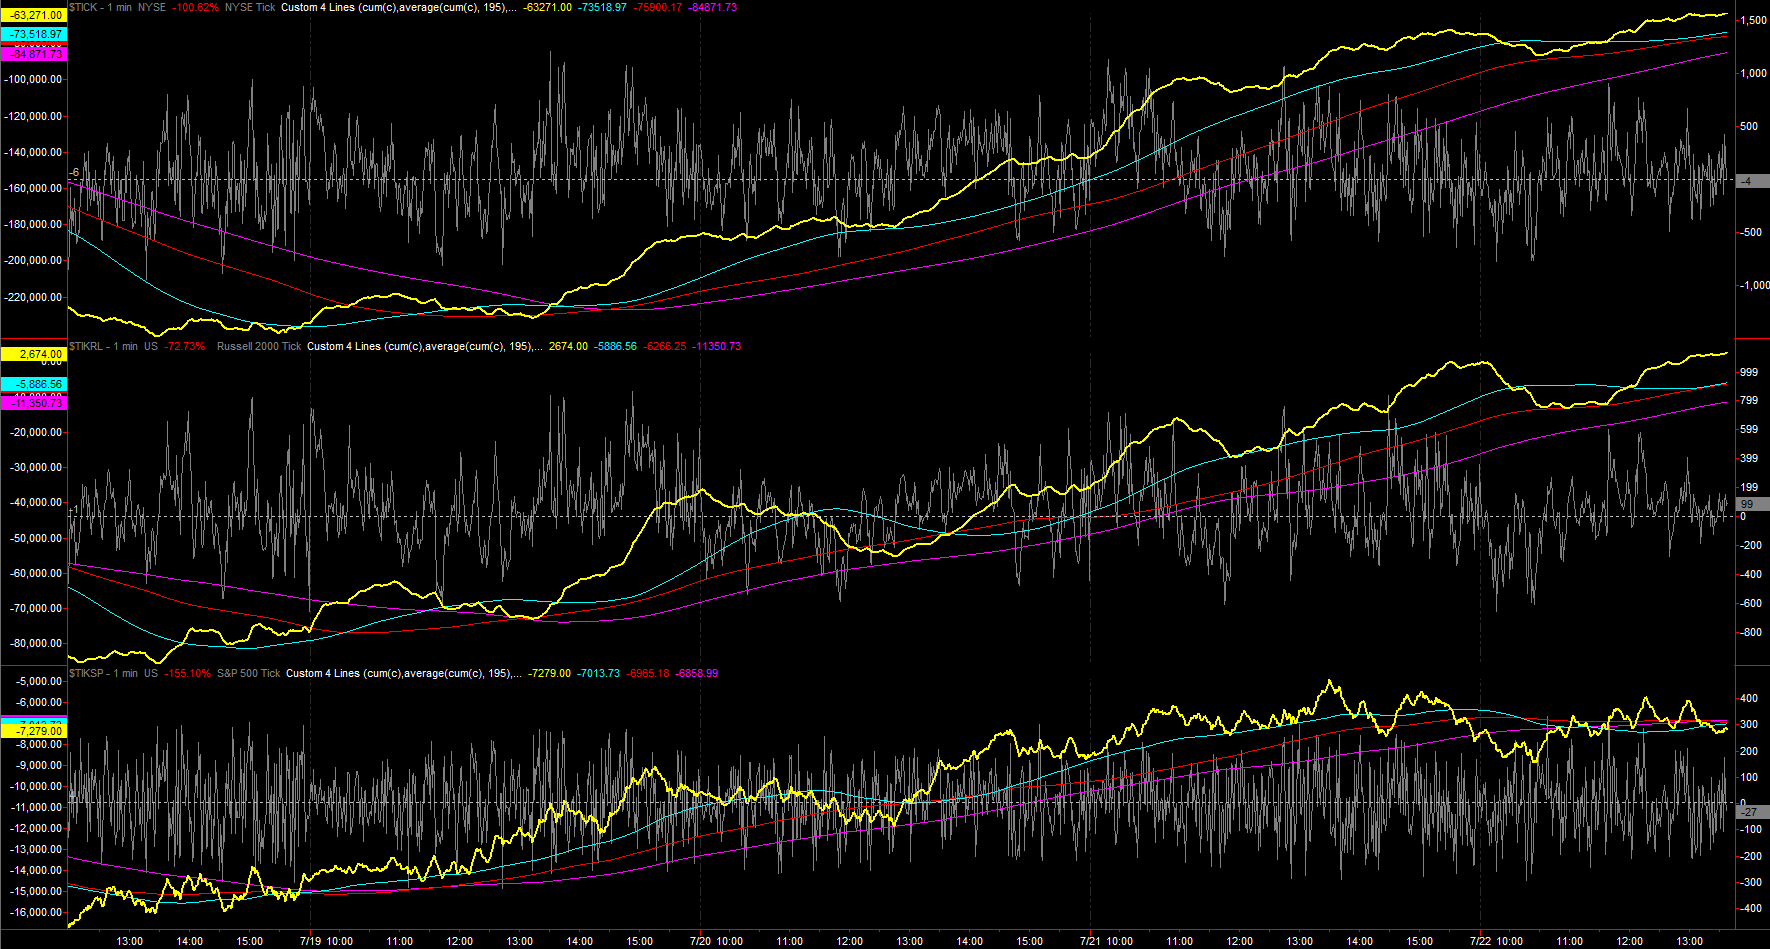
FWIW, the first two subgraphs compare NYSE Tick and R2K Tick. They look very similar in terms of the raw data, but the cume Ticks do differ. The third subgraph is S&P 500 Tick.
I have made a linkable version of a 3-day chart. Just change the number of days manually and "update" for other periods.
http://stockcharts.com/h-sc/ui?s=$TICK&p=1&yr=0&mn=0&dy=3&id=p91815521896&a=18 0203587
I think you need to be a real-time subscriber ($34.90/month, but big discounts for yearly).
Billy
 Posting Permissions
 Reply With Quote
