+ Reply to Thread
Page 1 of 3 1 3 LastLast
Results 1 to 10 of 26

Thread: Is It Really The Start of Something New? July 20, 2011

Hybrid View

  1. #1
    Join Date
    Dec 1969
    Location
    Brussels, Belgium
    Posts
    1,999

    Is It Really The Start of Something New? July 20, 2011

    Forum Clusters 110720.xlsx

    The thriller movie is progressing into the bear trap scenario which unfortunately shook the IWM robot out of its long position on Monday’s lows. It’s part of the risk-management game. After missing the best rally day of 2011, the robot is once again looking to enter a new long position at $ 83.06, which was also the exact most frequent limit entry price recently. What’s encouraging is that the 20 DMF refused to turn short after still being one hair away from a sell signal around noon yesterday, and the first serious buy programs in a week finally triggered around 1:30 pm as detected by the cumulative $TICK.

    Name:  tick110720.gif
Views: 1118
Size:  65.5 KB

    As far as today’s setup is concerned, IWM is simply back in the trading range that held from Monday till Thursday of last week, above the strongest of all support clusters. The fact that it escaped a nasty selloff under the support cluster and bounced back fast and strong yesterday can suggest the resuming of the uptrend as bears and short sellers have been painfully shaken out and disgusted for a while. Just like last week, the easy target is YR1 (85.68).

    Name:  iwm110720.gif
Views: 1113
Size:  46.6 KB

    QQQ is the leading ETF and is already trading above its own YR1 (59.02) pre-market. The easy floor progression is over as it is entering an extremely strong resistance cluster with strength of 27. The ability of QQQ to progress by small leaps and bounces above SR1 and QR1 (59.72) without a serious pullback over the next few hours and days will tell us a lot about the true potential sustainability of the rally for the overall market.

    Name:  qqq110720.gif
Views: 1133
Size:  42.2 KB


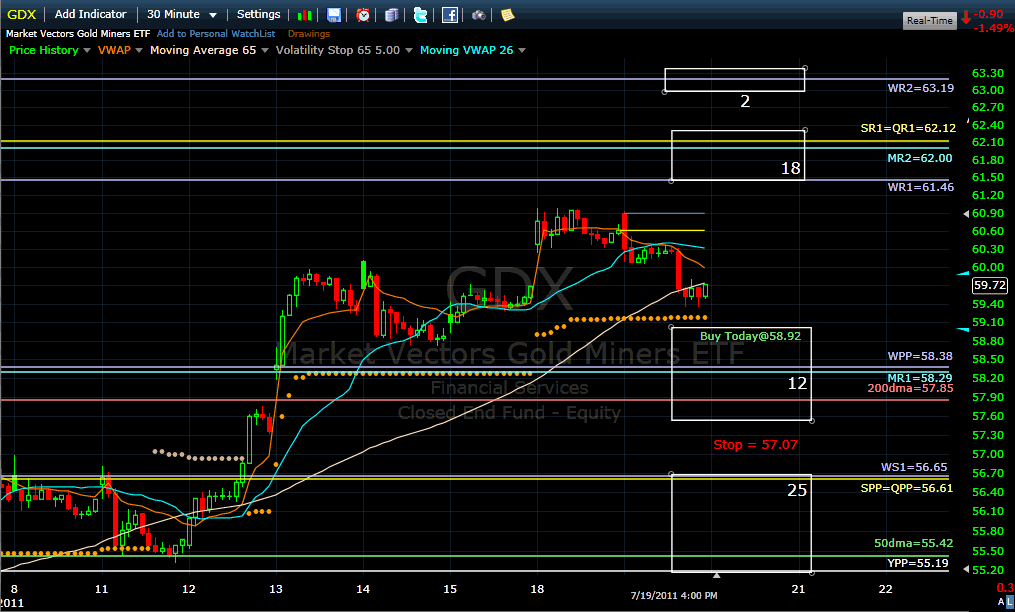
    GDX is looking poised to test its first support cluster before a new assault at the SR1 and QR1 (62.12) levels. Ideally, it should allow new entries at 58.92 and quickly regain its 5-day moving average (59.74 and rising) for an easy continuation of the rally.
    Billy

    Name:  gdx110720.gif
Views: 1058
Size:  43.9 KB

  2. #2

    Many Tnx

    Billy,

    I can't begin to tell you how much I appreciate these daily comments, charts and xcel file.

    Tnx

    Ilona.

  3. #3
    Billy,

    Thanks for your excellent work.

    Sorry if I have missed it before but where do I find your Cumalative Tick graph on Stockcharts ?

    Trev

    Quote Originally Posted by Billy View Post
    Attachment 9402

    The thriller movie is progressing into the bear trap scenario which unfortunately shook the IWM robot out of its long position on Monday’s lows. It’s part of the risk-management game. After missing the best rally day of 2011, the robot is once again looking to enter a new long position at $ 83.06, which was also the exact most frequent limit entry price recently. What’s encouraging is that the 20 DMF refused to turn short after still being one hair away from a sell signal around noon yesterday, and the first serious buy programs in a week finally triggered around 1:30 pm as detected by the cumulative $TICK.

    Attachment 9400

    As far as today’s setup is concerned, IWM is simply back in the trading range that held from Monday till Thursday of last week, above the strongest of all support clusters. The fact that it escaped a nasty selloff under the support cluster and bounced back fast and strong yesterday can suggest the resuming of the uptrend as bears and short sellers have been painfully shaken out and disgusted for a while. Just like last week, the easy target is YR1 (85.68).

    Attachment 9401

    QQQ is the leading ETF and is already trading above its own YR1 (59.02) pre-market. The easy floor progression is over as it is entering an extremely strong resistance cluster with strength of 27. The ability of QQQ to progress by small leaps and bounces above SR1 and QR1 (59.72) without a serious pullback over the next few hours and days will tell us a lot about the true potential sustainability of the rally for the overall market.

    Attachment 9403


    GDX is looking poised to test its first support cluster before a new assault at the SR1 and QR1 (62.12) levels. Ideally, it should allow new entries at 58.92 and quickly regain its 5-day moving average (59.74 and rising) for an easy continuation of the rally.
    Billy

    Attachment 9399
  4. #4
    Join Date
    Dec 1969
    Location
    Montreal Quebec Canada
    Posts
    55
    Quote Originally Posted by manucastle View Post
    Billy,

    Thanks for your excellent work.

    Sorry if I have missed it before but where do I find your Cumalative Tick graph on Stockcharts ?

    Trev
    You have to create your own

  5. #5
    Quote Originally Posted by Pierre Brodeur View Post
    You have to create your own
    Do you need a subscription to Stockcharts ?

    Trev

  6. #6

    replicating the chart

    free stockcharts wouldn't give me the option. then i tried on tos. after a few minutes of that, i knew that if i didn't stop either i or the computer was going to go flying out the window. if someone would post 1) how much it costs on stockcharts 2) an easy process for altering the y axis measurements 3) how to get the mountains etc.... and this for any platform that doesn't cost an arm and a leg... i would be most grateful.

  7. #7
    Join Date
    Dec 1969
    Location
    Montreal Quebec Canada
    Posts
    55

    This will sound stupid but ...

    -1- We always hear from technical analyst that previous support now becomes resistance. Why does cluster analysis ignore this "concept"?
    -2- Does Ichimoku supplement S/R analysis in any way then?
    -3- Finally, IWM is trading just below the Senkou Span A ( the bottom of the 60 minutes bearish cloud) which should act as resistance. For months now, you have no longer presented Ichimoku short term analysis. Is this by design because it no longer part of your investment process? I for one use them for risk and E(r) analysis and would be quite interested from time to time to get your view on this as far as IWM is concerned.

    Pierre Brodeur

  8. #8
    Join Date
    Dec 1969
    Location
    Brussels, Belgium
    Posts
    1,999
    Quote Originally Posted by Pierre Brodeur View Post
    -1- We always hear from technical analyst that previous support now becomes resistance. Why does cluster analysis ignore this "concept"?
    -2- Does Ichimoku supplement S/R analysis in any way then?
    -3- Finally, IWM is trading just below the Senkou Span A ( the bottom of the 60 minutes bearish cloud) which should act as resistance. For months now, you have no longer presented Ichimoku short term analysis. Is this by design because it no longer part of your investment process? I for one use them for risk and E(r) analysis and would be quite interested from time to time to get your view on this as far as IWM is concerned.

    Pierre Brodeur
    Bonjour Pierre,

    -1- Cluster and pivot analysis is not different from other technical analysis. Previous support becomes resistance and inversely. Only interpretation is easier with multi-pivots, since for each timeframe you can make the distinction between equilibrium S/R at pivot levels and intermediate consolidations in a trend at the various S123 and R123’s.

    -2- Ichimoku analysis is better for discretionary trading and for making real-time decisions intraday. It can complement S/R analysis but is hard to quantify. We know the optimal timeframe is the 60 minute with Ichimoku, while the multi-pivots weighings start on the daily timeframe, 6.5 times longer.

    -3- I still do my ichimoku daily routine analysis and know very well what you are talking about with the Senkou Span A. But remember that this forum is for discussing the robot signals and Ichimoku is no part of them, neither as Fibonacci or MIDAS for example.

    Knowing where the Ichimoku clouds and spans are is certainly impacting my commentary. I will try to make some Ichimoku updates in the VIT main forum when I find the time. It must encompass all timeframes and compare all main indices to be useful. While it takes me only 5 minutes in my daily routine, posting clearly and concisely about it to a mostly novice public would probably require me 2 hours of work. Also such posts usually spur tons of questions and I must sacrifice more of my rare and precious leisure time.
    Again, Ichimoku is mostly helpful for discretionary trading decisions and therefore cumbersome for robot traders.
    Billy

  9. #9
    Join Date
    Dec 1969
    Location
    Montreal Quebec Canada
    Posts
    55
    Quote Originally Posted by Billy View Post
    . Also such posts usually spur tons of questions and I must sacrifice more of my rare and precious leisure time.
    ... and I thought that with the robots, you NOW had plenty more of leisure time [lol]

    Thanks for the answer

    A bientot

    Pierre Brodeur

  10. #10
    Join Date
    Dec 1969
    Posts
    1,585

    Cume Tick in TradeStation

    For anyone who's interested, these are the settings for the out of the can "Custom 4 Lines" indicator in TradeStation that will replicate Billy's settings.

    Name:  cumetick.PNG
Views: 1078
Size:  40.7 KB

+ Reply to Thread

Posting Permissions

  • You may not post new threads
  • You may not post replies
  • You may not post attachments
  • You may not edit your posts