

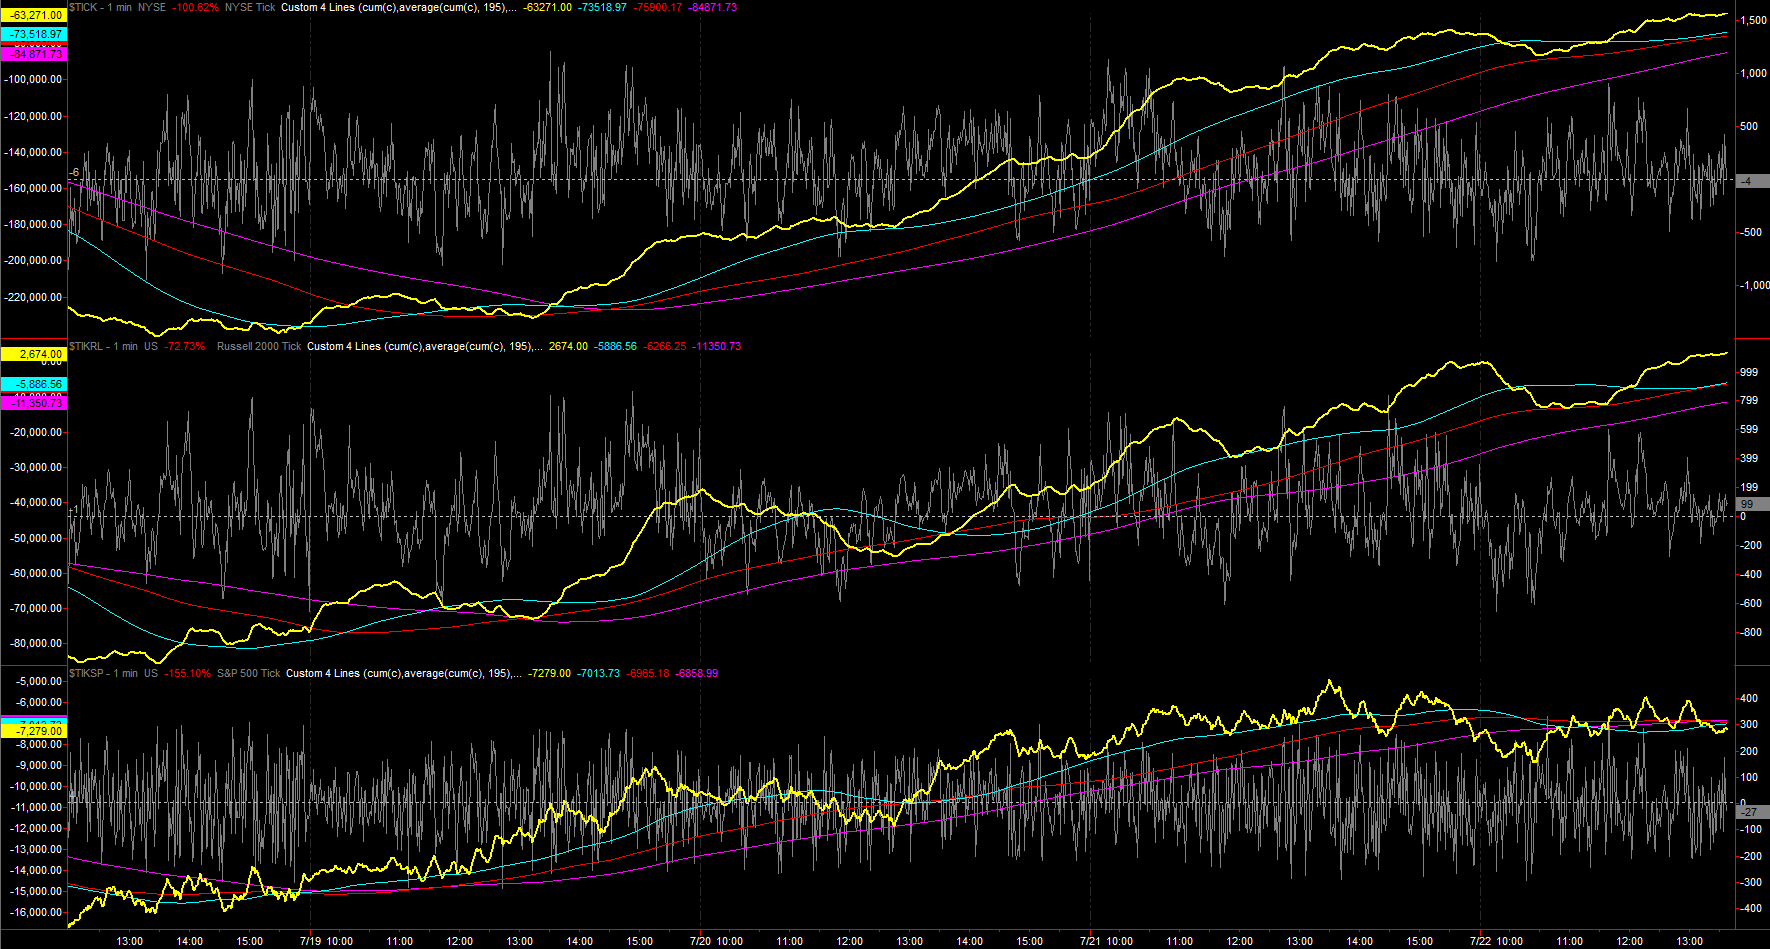
FWIW, the first two subgraphs compare NYSE Tick and R2K Tick. They look very similar in terms of the raw data, but the cume Ticks do differ. The third subgraph is S&P 500 Tick.


FWIW, the first two subgraphs compare NYSE Tick and R2K Tick. They look very similar in terms of the raw data, but the cume Ticks do differ. The third subgraph is S&P 500 Tick.
 Posting Permissions

 Reply With Quote