+ Reply to Thread
Page 1 of 2 1 2 LastLast
Results 1 to 10 of 17

Thread: Mean Reversion Expected in a Trend-Following Trade - July 5th 2011

  1. #1
    Join Date
    Dec 1969
    Location
    Brussels, Belgium
    Posts
    1,999

    Mean Reversion Expected in a Trend-Following Trade - July 5th 2011

    Forum Clusters 110705.xlsx

    This is the last « free access for everybody » pre-market clusters report. Starting on Wednesday morning, this forum will only be available to paid members subscribing to both robots. To avoid any interruption and to profit from the “early birds rates”, please make sure to visit http://www.effectivevolume.com/conte...on-Information
    All subscriptions already paid or paid prior to July 6th will be recorded as starting on July 6th for the renewal calendar.
    From now on, I’ll spend much less time convincing readers of the robot’s design quality and I will focus instead on professional trading of the multi-pivots and floor levels in relationship with the robot’s algorithms.
    For IWM, at the start of this shortened 4-session week, the most important development is that total floor selling pressure of 28 is beginning to outweigh the total floor buying pressure of 25. This implies that the current short-term overbought readings may soon resolve in a time consolidation or a pullback. However, the very strong first supports cluster (22) and the absence of any floor resistance before the Yearly R1 (85.68) 1.89% above Friday’s close, could easily resolve into an initial continuation of last week’s strong momentum.
    Whether the next pullback starts from here or later from YR1 vicinity, it is most likely to retest the upper boundary of the very powerful first cluster support. If the pullback starts on this Tuesday, that boundary will be exactly at daily S1 (83.06) which is also the optimal daily long entry from the IWM robot. The stop from the day’s entry is 81.19 not far away from the trailing stop of the initial robot position at 81.33. Both stops are well protected by numerous support confluences; therefore, 83.06 looks like an ideal low-risk entry both for adding up to your position or initializing a new one.
    You may remember that the robot’s initial risk was 2.20% from the entry price of 78.39. So, a 3:1 reward-risk setup would have given you a target of (78.39 * 1.066) = 83.56. On Friday’s close, IWM was already above the target with a 3.31 : 1 reward-risk ratio. We have checked with Pascal’s backtests and we found a very high probability that the current trend-following trade may be near its highest potential return. But the robot will only sell on an objective sell signal. Looking at the clusters structures, one scenario that I see as the most likely in the near term is a multi-days or weeks 4% trading range between QPP (82.28) and YPP (85.68) or a typical mean-reversion environment. Since the robot is now in trend-following mode with an excellent trailing stop, it will simply let the potential mean-reverting yo-yo game develop as long as a signal change doesn’t trigger. For discretionary traders, they may envision mean-reversion position-sizing trades within the expected 4% consolidation trading band.

    Name:  iwm110705.gif
Views: 358
Size:  45.4 KB

    The GDX robot remains pretty flat with its current long position entered at 53.26 on 6/23/2011. The statistical buy settings have remained neutral (i.e. weak) from the start and the floor structure has also handicapped the long trades with currently a total selling pressure of 33 battling a total support structure of 11.
    I am looking forward to welcome only dual robots subscribers on Wednesday morning and thank you in advance for joining what we hope will become the most advanced and private professional trading forum on the internet.
    Billy
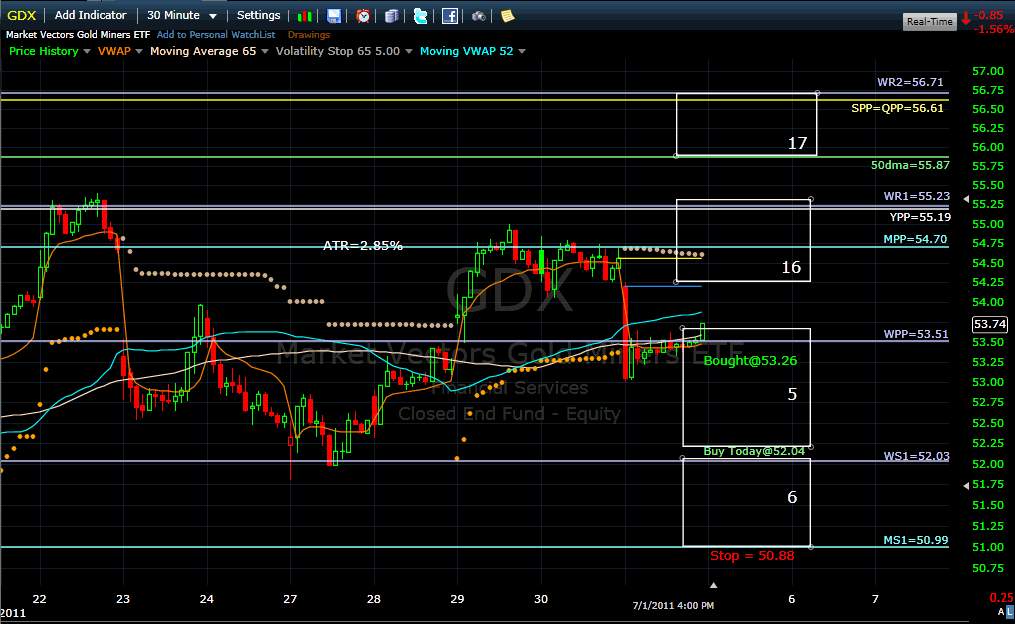
    Name:  gdx110705.gif
Views: 362
Size:  44.2 KB
    Last edited by Billy; 07-04-2011 at 05:57 AM.

  2. #2

    IWM subscription

    Billie,
    Are you saying that if we subscribe to IWM but not GDX we do not receive your daily multi-pivots comments/
    Bill

  3. #3
    Billy,

    Could you send along an updated SPY chart as well - thank

  4. #4
    Join Date
    Dec 1969
    Location
    Brussels, Belgium
    Posts
    1,999
    Quote Originally Posted by Bill Jagoe View Post
    Billie,
    Are you saying that if we subscribe to IWM but not GDX we do not receive your daily multi-pivots comments/
    Bill
    Dear Bill,

    Yes. We are sorry but that's the only way to maximize the added value from this forum as both robots setups will be discussed and compared. Optimal allocations between the two robots will also be suggested from time to time. All this is impossible to do without revealing both robots settings to the readers.
    Subscribers to only one robot will have access to the individual robot comments page from Pascal.
    Billy
    PS. You may upgrade to a dual robots subscription if you wish to. Please contact Pascal personally to proceed.

  5. #5
    Quote Originally Posted by Bill Jagoe View Post
    Billie,
    Are you saying that if we subscribe to IWM but not GDX we do not receive your daily multi-pivots comments/
    Bill
    Yes Bill, your understanding is correct.
    Some people do not need a specific interpretation or analysis, but only the signals.
    For those who need to read an interpretation by a former MM, then you might think that this is what you are paying for with the full subscriptiion and then that the second ETF is the free part.


    Pascal

  6. #6
    Join Date
    Dec 1969
    Location
    Brussels, Belgium
    Posts
    1,999
    Quote Originally Posted by adam ali View Post
    Billy,

    Could you send along an updated SPY chart as well - thank
    Here it is, Adam. SPY is already testing YR1 134.26), but also has a very powerful support cluster. Total selling pressure of 27 is now beginning to outweigh total buying pressure of 25. This is increasing the odds of some mean-reverting action for the whole market soon.
    I also show QQQ with a clear blue sky up to YR1 (59.02), similar to IWM. Here too, the total selling pressure of 28 begins to outweigh total buying pressure of 25, but the extremely powerful first support cluster should limit any pullback.
    Both ETFs are confirming a rising probability of some consolidation or pullback in the innings.
    Billy

    Name:  spy110705.gif
Views: 302
Size:  42.4 KB
    Name:  qqq110705.gif
Views: 342
Size:  41.5 KB

  7. #7
    Much obliged, as always.

  8. #8
    Join Date
    Dec 1969
    Location
    Brussels, Belgium
    Posts
    1,999

    IWM Dividend Today

    IWM will trade ex-dividend at the open today.
    The dividend is estimated around 25 cents.
    Billy

  9. #9

    Question

    Billy,

    I need to ask a question which may have an obvious answer but I need to know: What or where is "floor selling pressure of 28" and "floor buying pressure of 25"? I can't relate it to the chart.

    Thanks,

    Pablo

  10. #10
    Join Date
    Dec 1969
    Location
    Brussels, Belgium
    Posts
    1,999
    Quote Originally Posted by barbados11 View Post
    Billy,

    I need to ask a question which may have an obvious answer but I need to know: What or where is "floor selling pressure of 28" and "floor buying pressure of 25"? I can't relate it to the chart.

    Thanks,

    Pablo
    Pablo,
    For IWM,
    Total selling pressure is the total resistance clusters weights: 15 + 13 = 28
    Total buying pressure is the total support clusters strength: 22 + 3 = 25
    Billy

+ Reply to Thread

Posting Permissions

  • You may not post new threads
  • You may not post replies
  • You may not post attachments
  • You may not edit your posts