-
Russell 2000 A/D
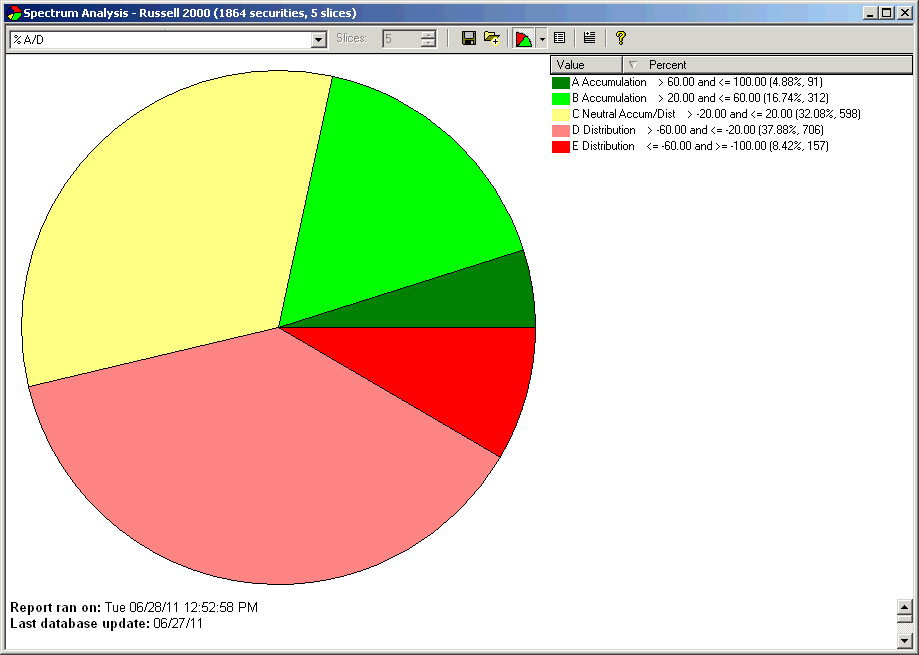
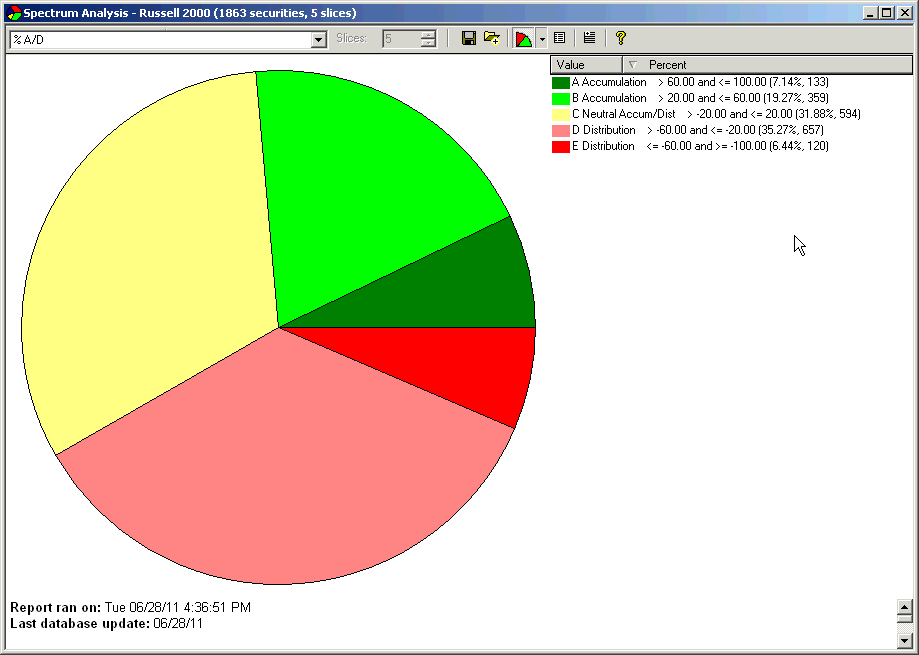
Billy; Your A&E chart using the IBD data spurred me to look at the Russell 2000 in HGSI as many of us are following the IWM Robot. The changes yesterday to today are interesting.
6/27; A: 4.88%, B: 16.74%, C: 32.08%, D: 37.88%, E: 8.42%
6/28; A: 7.14%, B:19.27%, C: 31.88%, D: 35.27%, E: 6.44%
There was a A-E crossover today.
Change
A: +46.31%
B: +15.11%
C: -0.62%
D: -6.89%
E: -23.51%
Attached are the %AD pie charts which make a lovely visual.
Best regards,
Robert


 Posting Permissions
- You may not post new threads
- You may not post replies
- You may not post attachments
- You may not edit your posts
Forum Rules


 Reply With Quote