Attachment 8976
If the FOMC statements certainly seems to have disappointed or given a pretext to a group of large players who were quick to sell heading into the close, the -46.6 % drop for the intraday 20 DMF was only 1/5th of Tuesdays extremely strong thrust of over +225%. So far, 80% of large players are keeping a buying stance since Tuesdays open.
When starting my stage analysis routine, I feared a disastrous intraday stage structure at the close as a proof of smart money fleeing the market. I found quite the contrary, with a neutral intraday score and no selling pressure similar to early June to be found whatsoever at the close.
Attachment 8974
Turning to the daily stage structure, I only saw a moderate retracement in the percentage of stocks in strong decline and they were 21.5% coming from Fridays close percentage of 36% and Tuesdays close percentage of 18.5%. Here too, the selling pressure trend keeps declining strongly, while accumulation remains absent. To me it feels more neutral than anything else and any strong up day from here could easily reverse the overall market trend to the upside. Renewed strong down days are likely to do less damage than in the prior selling wave as the market is now clearly in a medium to weakening decline sub-stage, preceding accumulation.
Attachment 8975
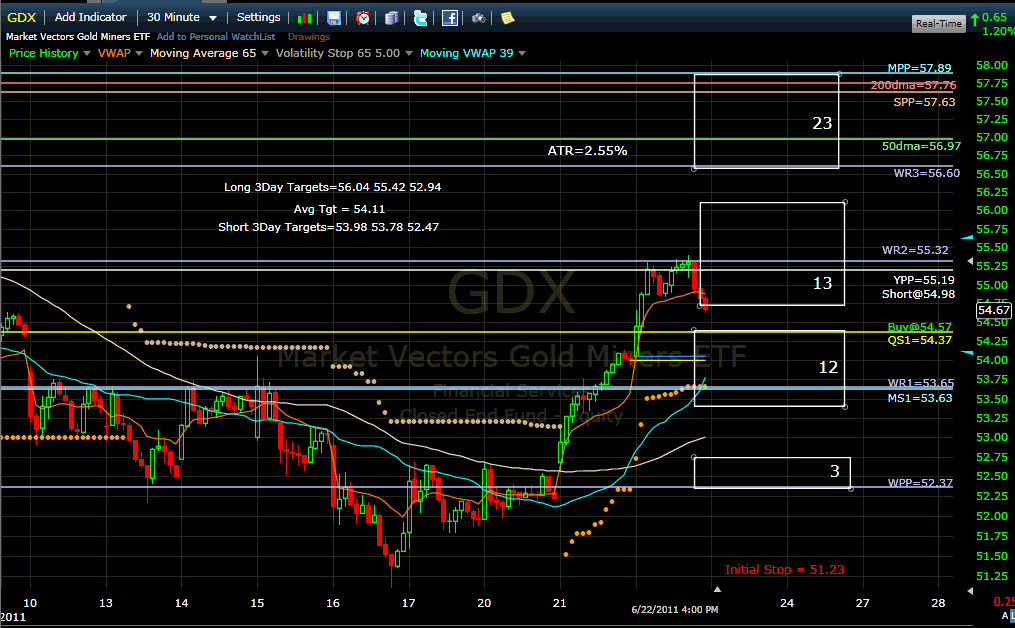
For IWM and GDX, the clusters and buy signals are fairly neutral too.
IWM closed right above its 3-day VWAP (79.98 blue line), so collective buyers and sellers are all at break-even for the week. Interestingly, this equilibrium point is very near todays robot limit entry of 79.94. Remember that if large professional buyers are waiting in ambush, they will take advantage of any drop below the intra-week VWAP to improve their own accounts VWAPs. Once again, I see no reason to worry as long as IWM trades and closes above QS1 (79.32) which is an important position size increase level for market makers.
Attachment 8972
For GDX, yearly pivot (55.19) and WR2 (55.32) were the reversal levels as expected. The second cluster resistance is more than enough to discourage any serious multi-pivots analyst, but I understand that no such analyst ever trades GDX. This instrument is the most erratic ETF I know, and youre much better at listening to Pascal than to me to gauge the outlook for such an emotional and irrational behavior. Todays limit buy point of 54.57 is near yesterdays close and you must accept the risk of the stop far away at 51.23 on a neutral signal
Billy
Attachment 8973


 Reply With Quote
