+ Reply to Thread
Page 1 of 2 1 2 LastLast
Results 1 to 10 of 12

Thread: Multi-Pivots and Gap Up for June 21, 2011

  1. #1
    Join Date
    Dec 1969
    Location
    Brussels, Belgium
    Posts
    1,999

    Multi-Pivots and Gap Up for June 21, 2011

    Forum Clusters 110621.xlsx

    Today all indices might gap up. IWM, SPY and GDX are all in a strongly bullish cluster outlook while QQQ remains very bearish but improving.

    The GDX robot is now offering a relatively strong buy signal in terms of LT/ST probabilities. The setup has not changed much from yesterday and there is a very comfortable initial support at the confluence of WS1 (50.70) and SS1 (50.64) just below our entry limit price of 51.57. The strong second resistance cluster should encourage you not to chase any gap up and buy at the robot limit instead to improve your reward-risk ratio.

    Name:  gdx110621.gif
Views: 302
Size:  46.2 KB

    For IWM, at the time of writing, pre-market points to a possible +0.60% gap up above WS1 (79.53) and QS1 (79.32). This is the level where last week’s Tuesday’s bounce failed on the next day. A close today and an opening tomorrow above QS1 would be the most ideal positive scenario for the robot’s position. The second resistance cluster is looking more sturdy, but a close above WR2 (80.83) could be the first step in a break-out attempt.
    IWM left the daily strong decline daily sub-stage yesterday and is now in weakening decline.

    Name:  iwm110621.gif
Views: 309
Size:  49.1 KB

    SPY is in an even more bullish cluster pattern with the first support cluster being twice as strong as the first resistance cluster.

    Name:  spy110621.gif
Views: 316
Size:  46.8 KB

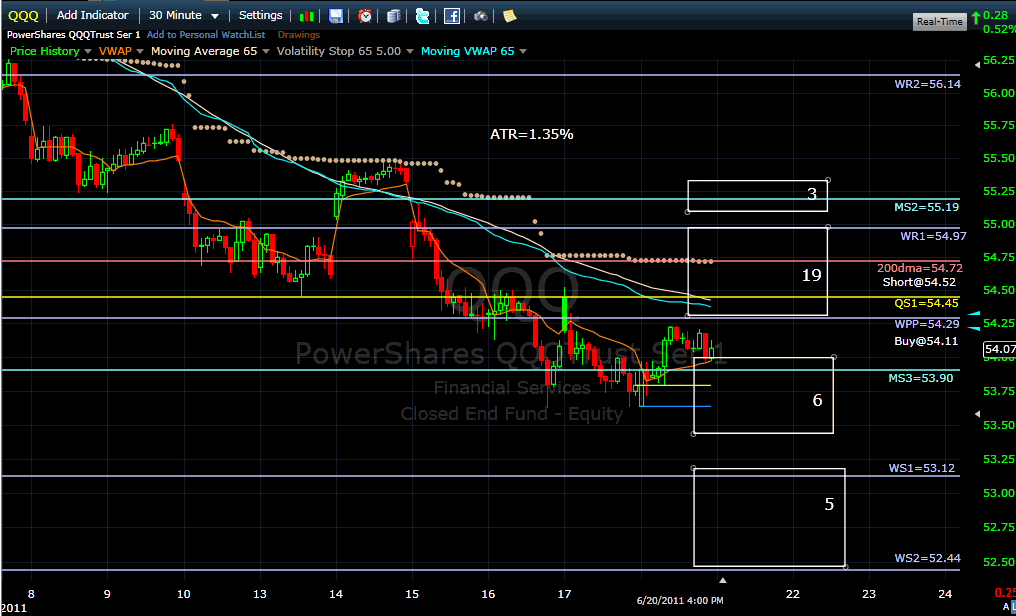
    QQQ remains a laggard and the first resistance cluster is really ominous, but the successful support from MS3 (53.90) is beginning to confirm that the sell programs may be temporarily turned off for this month’s timeframe. The launch of buy programs remains to be seen however.
    Billy

    Name:  qqq110621.gif
Views: 311
Size:  43.7 KB

  2. #2
    Billy,

    I can't recall you ever discussing volume in the context of these charts. Now I understand the 20DMF gives us a look at volume but it pays more attention to the size of that volume in a snapshot sort of way rather than as a sequence. (I think that's right.) Bob looks at volume - does it play an important part in your pivot methodology? Obviously, one of the reasons I'm bringing this up is yesterday's move was on low volume and many are pointing to that fact as indicative of a weakness in this potential rally's market structure.

  3. #3

    IWM-TNA Stop

    Billy; Yesterday and today the Robot maintained the stop for the trade initiated on 6/10 at 76.97. This translated to 65.82 for TNA yesterday. Today it translates to 65.72 which would involve lowering the TNA stop. In these instances that call for TNA stop lowering should the Robot be ignored?

    Thank you in advance.
    Best regards,
    Robert

  4. #4
    Correction: "...does it play an important part..."

    Meant "...does it play any part..."

  5. #5
    Join Date
    Dec 1969
    Location
    Brussels, Belgium
    Posts
    1,999
    Quote Originally Posted by adam ali View Post
    Billy,

    I can't recall you ever discussing volume in the context of these charts. Now I understand the 20DMF gives us a look at volume but it pays more attention to the size of that volume in a snapshot sort of way rather than as a sequence. (I think that's right.) Bob looks at volume - does it play an important part in your pivot methodology? Obviously, one of the reasons I'm bringing this up is yesterday's move was on low volume and many are pointing to that fact as indicative of a weakness in this potential rally's market structure.
    Adam,
    Volume used to play an important role, not anymore. In 2008 and 2009 my setups discussed in the VIT group (see archives) involved much volume monitoring at breakouts of clusters and major floor levels.
    Then, several research papers revealed that the official exchange reported volume had dwindled from 85% of total consolidated volume in 2007 down to only 25% in 2009. That's 75% of total true volume that you cannot monitor anymore as a retail investor and it is only traded by professionals, your most important actors to monitor.
    The only way left to use official volume data confidently for tracking large players activity is Pascal's Effective Volume and 20 DMF. Since they are at the basis of the robot's signals and market direction, I don't need to add anything to Pascal's comments.
    Traders who are still using old volume indicators and interpretations are lost and confused for a good reason. Only price pays. Billy

  6. #6
    Then, several research papers revealed that the official exchange reported volume had dwindled from 85% of total consolidated volume in 2007 down to only 25% in 2009. That's 75% of total true volume that you cannot monitor anymore as a retail investor and it is only traded by professionals, your most important actors to monitor.
    The only way left to use official volume data confidently for tracking large players activity is Pascal's Effective Volume and 20 DMF.

    The concept of dark pools and ATS is easy to understand. What is unclear to me is how all this volume is reported in an aggregate sense and what is the meaning of official exchange reported volume in relation to total consolidated volume. When you say it is only traded by professionals, how does that work?

    Parsing out official exchange volume as Pascal does is one approach (and perhaps the best one). But isn't this data available to everyone?

    Sounds like it may be time for me to revisit Larry Harris' book.

  7. #7
    Join Date
    Dec 1969
    Location
    Brussels, Belgium
    Posts
    1,999
    Quote Originally Posted by adam ali View Post
    The concept of dark pools and ATS is easy to understand. What is unclear to me is how all this volume is reported in an aggregate sense and what is the meaning of official exchange reported volume in relation to total consolidated volume. When you say it is only traded by professionals, how does that work?

    Parsing out official exchange volume as Pascal does is one approach (and perhaps the best one). But isn't this data available to everyone?

    Sounds like it may be time for me to revisit Larry Harris' book.
    Sure the estimated data is available from Markettells.com but for NYSE only and EOD.
    Not very useful for monitoring and interpreting IWM volume and even less intraday.
    I attach the file with the historical % of reported volume compared to total consolidated volume.
    Please promise me that you will swear to yourself never looking seriously at official reported volume again, or at people interpreting doctrinally such misleading data or I will think you are out of your mind!

    NYTOTVOL.xlsx

    Billy

  8. #8
    Join Date
    Dec 1969
    Location
    Brussels, Belgium
    Posts
    1,999
    Quote Originally Posted by brrim View Post
    Billy; Yesterday and today the Robot maintained the stop for the trade initiated on 6/10 at 76.97. This translated to 65.82 for TNA yesterday. Today it translates to 65.72 which would involve lowering the TNA stop. In these instances that call for TNA stop lowering should the Robot be ignored?

    Thank you in advance.
    Best regards,
    Robert
    Robert,

    This issue will ever be recurring and I repeat that I am against providing indicative limits and stops for related ETFs!
    These are kindly provided by Pascal based on the volatility correlation between the instruments. With the way triple leverage ETFs are adjusting daily with a decay or compounding factor, it is normal that their volatility is varying daily from the correlation with IWM. The actual stop is not changed. If IWM stop is hit, you get out of TNA whatever the indicative TNA stop. Period.
    Billy

  9. #9
    Join Date
    Dec 1969
    Posts
    1,585

    Volume Analysis

    @adam ali: since you mentioned me below, I thought I'd chime in :->. I do look at volume, but in specific contexts that are not simply daily aggregations. Specifically, I look at volume at price (volume profile), depth of market bid/ask volume (implied liquidity), realized liquidity (measured on the ES in part through active boundaries), volume delta (difference between up and down volume), and bar-by-bar relative volume.

    Regarding relative volume, some may note that today's running total is again below average; however, on a bar by bar comparison (each bar measured against a 20 day average for That Bar only), the pushes to the upside have been on above average volume, confirming strength. Here's a snapshot from today:

    Name:  es 5 min vol 6-21-11 13-08.PNG
Views: 196
Size:  23.8 KB

    It's true that futures markets do not have the same reporting problems of equities, as all trades are centrally cleared and reported. So why not just use the daily totals in the futures as a proxy for the imperfectly reported cash volume? Even notionally, the futures markets are very small by comparison.

    Also, much of the day's volume is due to program buying and selling and HFT churning, which affects both the cash and futures. How much algo trading there is in any day can greatly skew the aggregates, but seems not to skew the relative (bar by bar) as much.
    Last edited by EB; 06-21-2011 at 01:09 PM. Reason: changed pic

  10. #10
    Thanks, Bob. In some ways, what you say raises more questions than it answers (for me at least). Maybe the first question is this: is there a natural equivalence between the futures and cash markets in terms of volume (meaning as cash volume increases in one venue, it will in the other venue)? Otherwise, why look at futures for volume?

    I see your point about looking at individual bars but for those who don't have the alacrity to do so, then where to go for volume analysis - relative to Billy's point about Pascal being the one place for this?

    I feel like I'm wading in muddy waters - personally speaking - discussing these issues at this level of granularity. (I'm not sure I'm even thinking about all this correctly.) From a hierarchical POV, there is the total consolidated volume, then the official exchange volume, and then there's the parsing Pascal does...just trying to understand what's what here.

+ Reply to Thread

Posting Permissions

  • You may not post new threads
  • You may not post replies
  • You may not post attachments
  • You may not edit your posts