-
Lessons From The Multi-Pivots For June 20, 2011
Forum Clusters 110620.xlsx
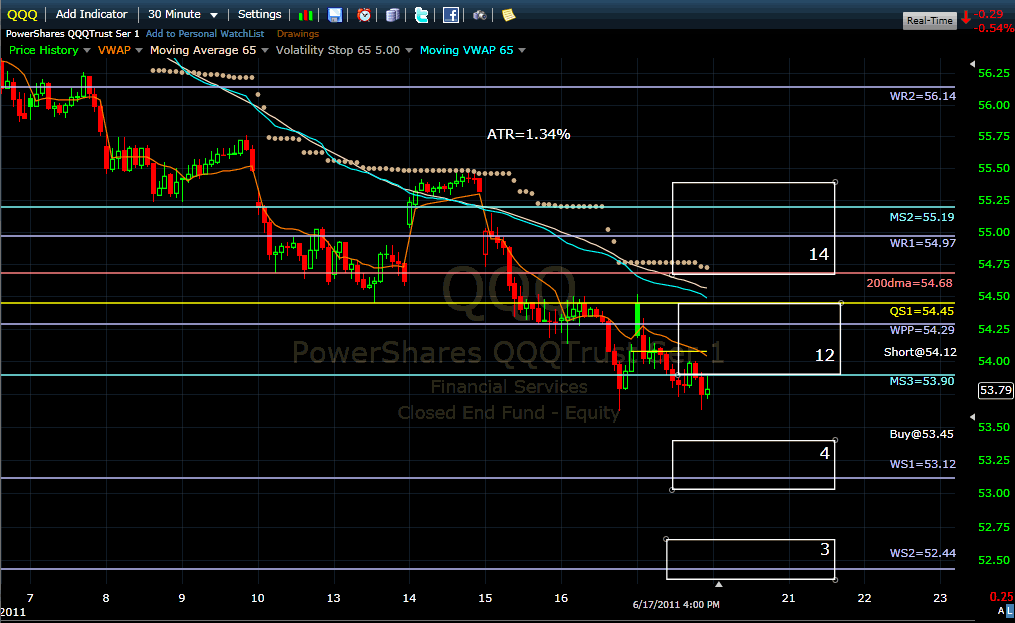
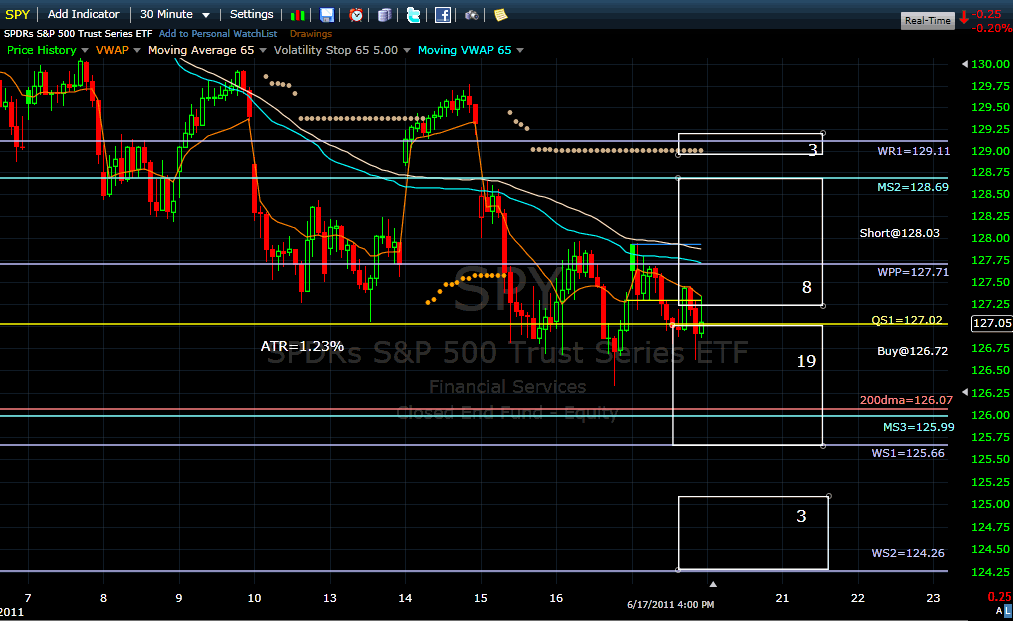
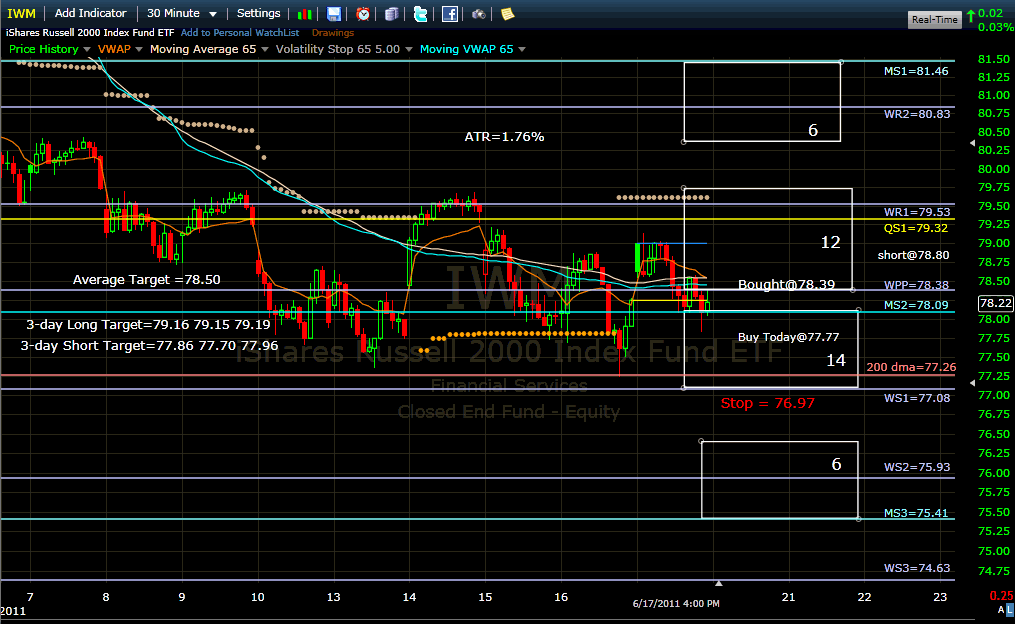
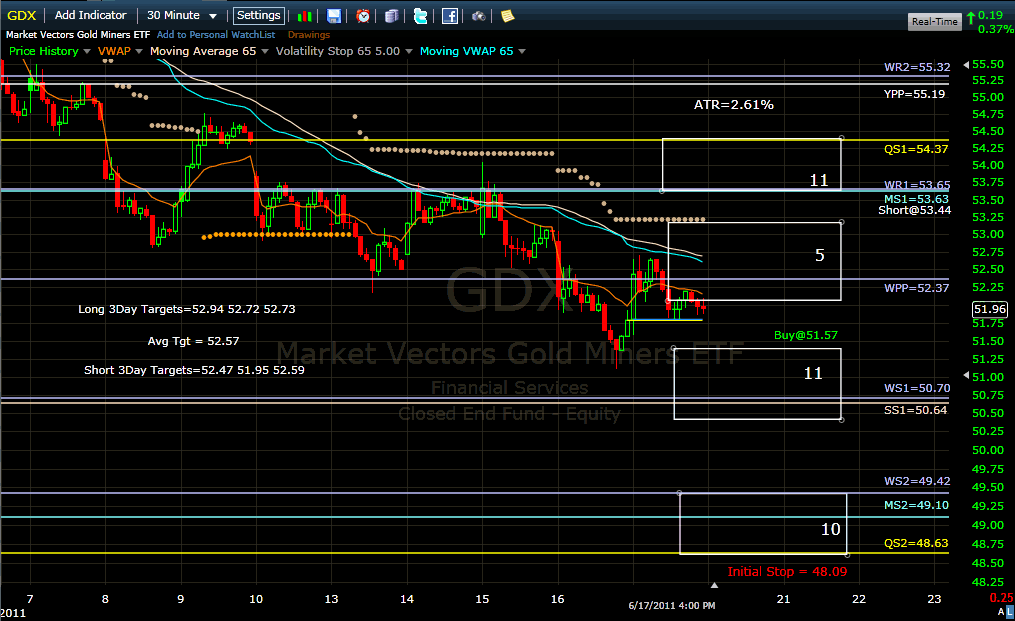
The roadmap outlook for Monday is very bullish for SPY and GDX, slightly bullish for IWM and extremely bearish for QQQ.
The QQQ is the real source of technical concern for this market, plunging below the 200-day moving average and with almost no support left below last week’s lows. It is now in its first week of weekly “early distribution” sub-stage which is the very last neutral to slightly bullish point in the intermediate term stages cycle.
The two support clusters are totaling a bleak strength of 7 versus strength of 26 for the two resistance clusters! This is an extremely bearish imbalance rarely seen for any index. A down trend day on Monday could go at full speed to WS2 (52.44). However, the bullish outlook for SPY and IWM is not warning of an overall market washout. Most important too, as mentioned in other posts, MS3 (53.90) has a 95% probability of marking the low for the month of June and many algorithms must be programmed to stop selling at the current level. If you actually adjust Friday’s ex-dividend close with the 12.1 cents dividend, the adjusted close was actually 53.91, just above MS3! The adjusted first support cluster would therefore become 7 instead of 4. This MS3 of QQQ will be the most important level to watch on Monday for gauging the chances of a successful bullish reversal in SPY and IWM. QQQ should really not try to run away decisively to the downside from here and any attempt to do so must quickly be bought heavily by large players to avoid cascading panic selling.

The outlook for SPY is much more reassuring and the clusters’ support/resistance ratios are very bullish with 19:8 for the first clusters and a total of 22:11 for the two clusters taken together. Here also the MS3 (125.99) becomes important and is in perfect confluence with the 200-day moving average (126.07). I would almost bet the castle that it is where the selling programs will stop and reverse until the end of the month.

IWM is slightly less bullish than SPY but will be mostly helped by its improving Relative Strength vs. SPY. The first support/resistance clusters strength is 14:12. In the hypothesis of a last capitulation selling flush early next week, the robot’s trailing stop at 76.97 is just under the confluent cushion of the 200-day moving average (77.26) and the new WS1 (77.08). If the stop is hit, the robot will exit the long position. Due to the very strong buy probabilities, it will likely look to re-enter a long position on the next day but at a new entry price that could differ greatly depending on Monday’s close. The robot executes its plan first and never tries to anticipate.

Although the new long buy signal for GDX is rather weak in terms of LT/ST probabilities, I like the proposed setup a lot. An entry at a limit of 51.57 would be just above the first support cluster with a good strength of 11 while the initial stop at 48.09 will be below a potential down trending day range and further protected by the second support cluster also strong with strength of 10. The initial one-day move after entry should be easily driven to the upside thanks to the weak first resistance cluster’s strength of 5.
Billy

Last edited by Billy; 06-20-2011 at 01:31 AM.
Reason: Corrected IWM chart + Corrected QQQ daily stage to weekly stage
 Posting Permissions
- You may not post new threads
- You may not post replies
- You may not post attachments
- You may not edit your posts
Forum Rules


 Reply With Quote