+ Reply to Thread
Page 1 of 2 1 2 LastLast
Results 1 to 10 of 30

Thread: Lessons From The Multi-Pivots For June 20, 2011

Hybrid View

  1. #1
    Join Date
    Dec 1969
    Location
    Brussels, Belgium
    Posts
    1,999

    Lessons From The Multi-Pivots For June 20, 2011

    Forum Clusters 110620.xlsx

    The roadmap outlook for Monday is very bullish for SPY and GDX, slightly bullish for IWM and extremely bearish for QQQ.

    The QQQ is the real source of technical concern for this market, plunging below the 200-day moving average and with almost no support left below last week’s lows. It is now in its first week of weekly “early distribution” sub-stage which is the very last neutral to slightly bullish point in the intermediate term stages cycle.
    The two support clusters are totaling a bleak strength of 7 versus strength of 26 for the two resistance clusters! This is an extremely bearish imbalance rarely seen for any index. A down trend day on Monday could go at full speed to WS2 (52.44). However, the bullish outlook for SPY and IWM is not warning of an overall market washout. Most important too, as mentioned in other posts, MS3 (53.90) has a 95% probability of marking the low for the month of June and many algorithms must be programmed to stop selling at the current level. If you actually adjust Friday’s ex-dividend close with the 12.1 cents dividend, the adjusted close was actually 53.91, just above MS3! The adjusted first support cluster would therefore become 7 instead of 4. This MS3 of QQQ will be the most important level to watch on Monday for gauging the chances of a successful bullish reversal in SPY and IWM. QQQ should really not try to run away decisively to the downside from here and any attempt to do so must quickly be bought heavily by large players to avoid cascading panic selling.

    Name:  QQQ110620.gif
Views: 1143
Size:  42.8 KB

    The outlook for SPY is much more reassuring and the clusters’ support/resistance ratios are very bullish with 19:8 for the first clusters and a total of 22:11 for the two clusters taken together. Here also the MS3 (125.99) becomes important and is in perfect confluence with the 200-day moving average (126.07). I would almost bet the castle that it is where the selling programs will stop and reverse until the end of the month.

    Name:  SPY110620.gif
Views: 1176
Size:  45.5 KB

    IWM is slightly less bullish than SPY but will be mostly helped by its improving Relative Strength vs. SPY. The first support/resistance clusters strength is 14:12. In the hypothesis of a last capitulation selling flush early next week, the robot’s trailing stop at 76.97 is just under the confluent cushion of the 200-day moving average (77.26) and the new WS1 (77.08). If the stop is hit, the robot will exit the long position. Due to the very strong buy probabilities, it will likely look to re-enter a long position on the next day but at a new entry price that could differ greatly depending on Monday’s close. The robot executes its plan first and never tries to anticipate.

    Name:  IWM110620.gif
Views: 1180
Size:  49.0 KB

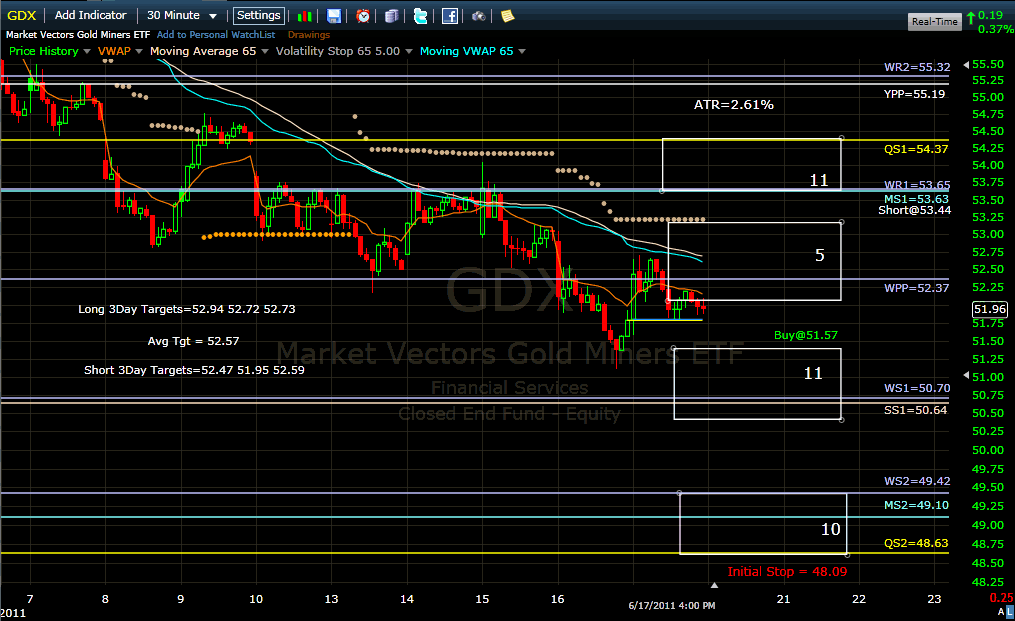
    Although the new long buy signal for GDX is rather weak in terms of LT/ST probabilities, I like the proposed setup a lot. An entry at a limit of 51.57 would be just above the first support cluster with a good strength of 11 while the initial stop at 48.09 will be below a potential down trending day range and further protected by the second support cluster also strong with strength of 10. The initial one-day move after entry should be easily driven to the upside thanks to the weak first resistance cluster’s strength of 5.
    Billy

    Name:  GDX110620.gif
Views: 1197
Size:  47.3 KB
    Last edited by Billy; 06-20-2011 at 01:31 AM. Reason: Corrected IWM chart + Corrected QQQ daily stage to weekly stage

  2. #2
    Join Date
    Dec 1969
    Location
    Medford, OR USA
    Posts
    24

    GDX Buy Signal

    Billy or Pascal,
    The GDX robot gave a new signal to buy at $51.57. Is the robot telling us to wait for a drop to the $51.57 before buying? If so, the strong MF into the sector may not give us to opportunity to by at $51.57. If the train leaves the station should we chase the price or wait for robot entry price?
    Steve

    Quote Originally Posted by Billy View Post
    Attachment 8893

    The roadmap outlook for Monday is very bullish for SPY and GDX, slightly bullish for IWM and extremely bearish for QQQ.

    The QQQ is the real source of technical concern for this market, plunging below the 200-day moving average and with almost no support left below last week’s lows. It is now in its first week of weekly “early distribution” sub-stage which is the very last neutral to slightly bullish point in the intermediate term stages cycle.
    The two support clusters are totaling a bleak strength of 7 versus strength of 26 for the two resistance clusters! This is an extremely bearish imbalance rarely seen for any index. A down trend day on Monday could go at full speed to WS2 (52.44). However, the bullish outlook for SPY and IWM is not warning of an overall market washout. Most important too, as mentioned in other posts, MS3 (53.90) has a 95% probability of marking the low for the month of June and many algorithms must be programmed to stop selling at the current level. If you actually adjust Friday’s ex-dividend close with the 12.1 cents dividend, the adjusted close was actually 53.91, just above MS3! The adjusted first support cluster would therefore become 7 instead of 4. This MS3 of QQQ will be the most important level to watch on Monday for gauging the chances of a successful bullish reversal in SPY and IWM. QQQ should really not try to run away decisively to the downside from here and any attempt to do so must quickly be bought heavily by large players to avoid cascading panic selling.

    Attachment 8894

    The outlook for SPY is much more reassuring and the clusters’ support/resistance ratios are very bullish with 19:8 for the first clusters and a total of 22:11 for the two clusters taken together. Here also the MS3 (125.99) becomes important and is in perfect confluence with the 200-day moving average (126.07). I would almost bet the castle that it is where the selling programs will stop and reverse until the end of the month.

    Attachment 8891

    IWM is slightly less bullish than SPY but will be mostly helped by its improving Relative Strength vs. SPY. The first support/resistance clusters strength is 14:12. In the hypothesis of a last capitulation selling flush early next week, the robot’s trailing stop at 76.97 is just under the confluent cushion of the 200-day moving average (77.26) and the new WS1 (77.08). If the stop is hit, the robot will exit the long position. Due to the very strong buy probabilities, it will likely look to re-enter a long position on the next day but at a new entry price that could differ greatly depending on Monday’s close. The robot executes its plan first and never tries to anticipate.

    Attachment 8896

    Although the new long buy signal for GDX is rather weak in terms of LT/ST probabilities, I like the proposed setup a lot. An entry at a limit of 51.57 would be just above the first support cluster with a good strength of 11 while the initial stop at 48.09 will be below a potential down trending day range and further protected by the second support cluster also strong with strength of 10. The initial one-day move after entry should be easily driven to the upside thanks to the weak first resistance cluster’s strength of 5.
    Billy

    Attachment 8895
  3. #3
    Join Date
    Dec 1969
    Location
    Brussels, Belgium
    Posts
    1,999
    Quote Originally Posted by slgerritz View Post
    Billy or Pascal,
    The GDX robot gave a new signal to buy at $51.57. Is the robot telling us to wait for a drop to the $51.57 before buying? If so, the strong MF into the sector may not give us to opportunity to by at $51.57. If the train leaves the station should we chase the price or wait for robot entry price?
    Steve
    Steve, if you want to take advantage of all the edges included in the robot design, you need to wait for an entry limit to be hit. A big chunk of the outperformance of the robots is stemming from waiting for the optimal entry points. The initial optimal stop is an important function of the limitentry price. No need to chase the train blindly, tomorrow may offer another optimal entry limit for the risk management system of the robot. If you buy at another point, the robot management becomes useless and it becomes pure discretionary trading.
    Billy

  4. #4
    Quote Originally Posted by slgerritz View Post
    Billy or Pascal,
    The GDX robot gave a new signal to buy at $51.57. Is the robot telling us to wait for a drop to the $51.57 before buying? If so, the strong MF into the sector may not give us to opportunity to by at $51.57. If the train leaves the station should we chase the price or wait for robot entry price?
    Steve
    Really, we cannot advise explicitly on this point.
    In the long run, buying at the open for GDX is also working fine as the back-test has shown.
    On the other hand, the GDX ATR is 2.82% right now. The buy point is 0.77% below last Friday's close. This means that statistically, the buy point is well within the usual day volatility.


    Pascal

  5. #5
    Join Date
    Dec 1969
    Location
    Medford, OR USA
    Posts
    24

    Gdx atr 2.82

    Pascal,
    Where is the GDX ATR of 2.82 derived from? On freecharts.com is says it has a daily ATR 14 of 1.46.
    Steve


    Quote Originally Posted by Pascal View Post
    Really, we cannot advise explicitly on this point.
    In the long run, buying at the open for GDX is also working fine as the back-test has shown.
    On the other hand, the GDX ATR is 2.82% right now. The buy point is 0.77% below last Friday's close. This means that statistically, the buy point is well within the usual day volatility.


    Pascal

  6. #6
    Quote Originally Posted by slgerritz View Post
    Pascal,
    Where is the GDX ATR of 2.82 derived from? On freecharts.com is says it has a daily ATR 14 of 1.46.
    Steve
    We are using a 20D ATR.

    Pascal

  7. #7
    Billy,

    Stockcharts.com have recently instituted pivots on their charts. In their blog, they list their standard pivot calculation as the following:

    Pivot Point (P) = (High + Low + Close)/3

    Support 1 (S1) = (P x 2) - High

    Support 2 (S2) = P - (High - Low)

    Resistance 1 (R1) = (P x 2) - Low

    Resistance 2 (R2) = P + (High - Low)

    This appears different than the calculation used on this site. If true, do you happen to know why the difference?

    Adam

  8. #8
    Join Date
    Dec 1969
    Posts
    1,585

    Pivot Origins

    As to the initial formulas for daily pivots and support/resistance levels, I have vague recollections of old time commodity traders saying they existed as early as the 1970's. But, they could have existed long before and originated in other markets (perhaps even as a footnote in the Buttonwood Agreement).

    The idea was apparently scaled up to multiple time frames, including weekly and monthly, by none other than John Person himself (whose book you often cite, Billy) along with some other CBOT traders in 1984. From his website:

    Before going any further let me further explain who uses the pivot point numbers, mainly floor traders, hedge funds, prop traders and large speculators all use them. However, the popularity is growing as investors quest for education increases. I picked up on the method back in 1984 as a colleague was showing me how to day trade the foreign currencies, namely the Swiss Franc and the German Deutsche Mark. This was way before forex was popular. In fact trading currencies at the CME has been around since the 1970's. Pivot Point analysis and using a pivot point calculator worked fairly well in those days so I incorporated it for the market I had a passion for, which was Bonds. After using them for some time as a “crutch” I was losing interest as a day trader. I experimented with them using this concept of a longer time period namely on a weekly basis. Wow what a discovery! Then I came to the conclusion to try to use them on a Monthly basis after all I was a believer in Daily, Weekly and Monthly Charts. In fact the Chicago Board Of Trade use to give out a monthly Bond Chart and another friend of mine on the floor use to get together with me for “homework” sessions. We would do longer term chart studies using Moving Averages. I figured why not look at the monthly pivot point price targets too. WOW again! I discovered that I could look at a potential price range target in the future based on price action in the past. The longer the time frames the more power or market move would happen.
    A more candid and colorful description of these after-market "homework" sessions is here, in which Person is not afraid to give Heineken its due credit.

    From there, it's conceivable that the NASDAQ, perhaps with other exchanges, created the more formal system you were taught, with weightings and even higher time frames.

  9. #9
    Join Date
    Dec 1969
    Location
    Medford, OR USA
    Posts
    24

    Backtest result table for GDX Robot

    Pascal or Billy,

    Have you created a table showing the results of the backtesting of the GDX Robot? If so can you share it?
    Steve


    Quote Originally Posted by EB View Post
    As to the initial formulas for daily pivots and support/resistance levels, I have vague recollections of old time commodity traders saying they existed as early as the 1970's. But, they could have existed long before and originated in other markets (perhaps even as a footnote in the Buttonwood Agreement).

    The idea was apparently scaled up to multiple time frames, including weekly and monthly, by none other than John Person himself (whose book you often cite, Billy) along with some other CBOT traders in 1984. From his website:


    A more candid and colorful description of these after-market "homework" sessions is here, in which Person is not afraid to give Heineken its due credit.

    From there, it's conceivable that the NASDAQ, perhaps with other exchanges, created the more formal system you were taught, with weightings and even higher time frames.

  10. #10
    Bob,

    That's a funny interview with John Person. He seems like a guy you'd like to have a Heineken (or two) with. Sounds like he and his buddies had some great times back then while finding better ways to trade.

+ Reply to Thread

Posting Permissions

  • You may not post new threads
  • You may not post replies
  • You may not post attachments
  • You may not edit your posts