+ Reply to Thread
Results 1 to 6 of 6

Thread: IWM Robot for June 13, 2011

  1. #1
    Join Date
    Dec 1969
    Location
    Brussels, Belgium
    Posts
    1,999

    IWM Robot for June 13, 2011

    Forum Clusters 110613.xlsx

    The new long position of the IWM robot was opened at 78.39 and incurs a drawdown of 0.5% at Friday’s close. It would take another drop of – 1.73% intraday on Monday for our stop loss of 76.65 to be triggered. The stop loss is below the strong confluence of potential support from the 200-day moving average (76.83) and the new WS1 (76.74). On Friday, the 200 dma was the only support left before the stop, so we start the week with stronger nearby support.
    As a first support cluster however, it is of the same strength of 12 as the first resistance cluster. But the bulk of the resistance is in the higher half of the resistance cluster, which should help a bounce scenario if large players’ programs are willing to cooperate. Notice also the weak second resistance cluster (strength of 4). The buy entry limit of 77.45 on Monday is offering another opportunity to participate in this very strong buy statistical configuration.
    SPY and QQQ’s clusters strengths are expected to help in the bounce scenario with much more bullish setups than for IWM. Expect IWM to somewhat underperform until QS1 (79.32) is decisively crossed to the upside.
    Quarter’s and Month’s ends are approaching fast and if large players want to save their quarterly window-dressing, they are likely to target at least the Quarterly pivot of 81.80 which coincides with the most important support area from the beginning of the quarter in April. This would be the same equilibrium level as the first quarter and would leave the doors open to all scenarios for the rest of the year. If the market ever falls hard from here, the robot will simply take its loss in disciplined respect of its optimal trading plan and will therefore show no regrets whatsoever.
    On the IWM chart below, I am showing the last 3-day most probable long and short targets. The average of both short and long targets is 78.63. A daily close above 78.63 on Monday would hint at a confirmation of the potential trend reversal.
    Billy
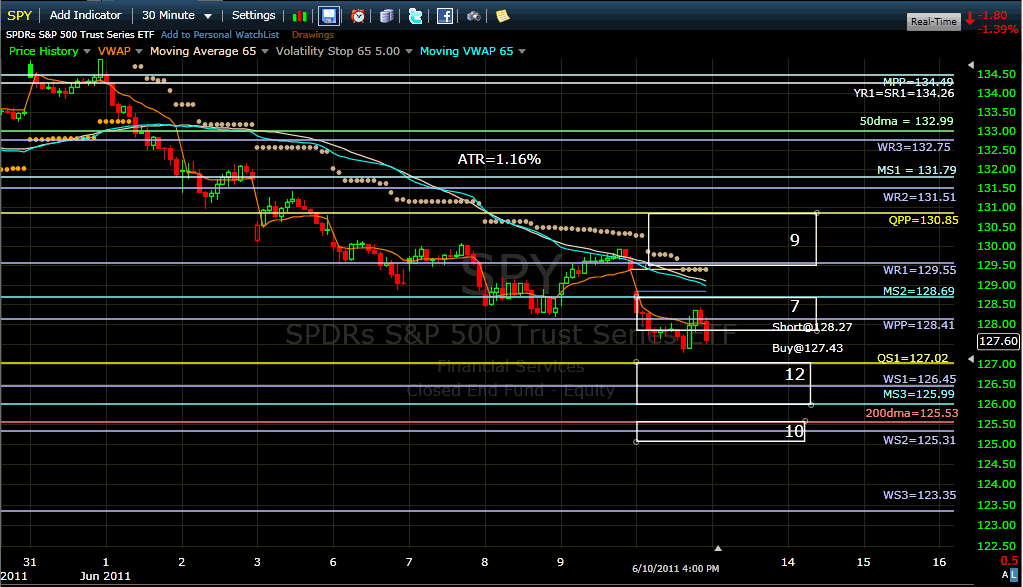
    Name:  iwm110613..gif
Views: 278
Size:  46.8 KBName:  qqq110613..gif
Views: 287
Size:  42.0 KBName:  spy110613..gif
Views: 284
Size:  44.3 KB
    Attached Files
    Last edited by Billy; 06-12-2011 at 04:10 PM.

  2. #2
    Hi Billy. I was wondering if prior price support / resistance has any bearing on your analysis. Looking at Friday's low it is very close to the previous 'major' low back on march 15th which also was/is somewhat close to support that held nicely back in January and February as well. Do the major players and/or HFT's track previous major lows?

  3. #3
    Join Date
    Dec 1969
    Location
    Brussels, Belgium
    Posts
    1,999
    Quote Originally Posted by happy View Post
    Hi Billy. I was wondering if prior price support / resistance has any bearing on your analysis. Looking at Friday's low it is very close to the previous 'major' low back on march 15th which also was/is somewhat close to support that held nicely back in January and February as well. Do the major players and/or HFT's track previous major lows?
    Happy,

    I don't know but I guess they likely do track previous major lows like everybody else. Recently they especially like to hit obvious stops there, shaking out weak hands before reversing sharply in the other direction. This is happening on all timeframes where we constantly witness fast reverse moves born out of false moves. That's because fishing for these stops helps them reduce the VWAP while filling their positions and they will force the public to chase them in the following days, often with big gaps at the open.
    I am aware of these lows and I try to evaluate their potential support strengths with the current pivot clusters. These are the ones that really matter.
    Billy

  4. #4
    Join Date
    Dec 1969
    Location
    Seattle, Washington USA
    Posts
    151

    some graphs and analysis of the fractal limit order shake out

    Hi Billy--

    I ran across this article on Zero Hedge this weekend. Perhaps others saw it, too. But it seems to tell a very similar story as you do. I'm glad you have spotted this phenomenon.

    I admit I find it both fascinating and a little horrifying.

    Many thanks,
    Last edited by nickola.pazderic; 06-13-2011 at 11:36 AM.

  5. #5
    Join Date
    Dec 1969
    Location
    Brussels, Belgium
    Posts
    1,999
    Quote Originally Posted by nickola.pazderic View Post
    Hi Billy--

    I ran across this article on Zero Hedge this weekend. Perhaps others saw it, too. But it seems to tell a very similar story as you do. I'm glad you have spotted this phenomenon.

    I admit I find it both fascinating and a little horrifying.

    Many thanks,
    We may be witnessing a live example of a programmed intraday shakeout reversal. Volume should pick up from here to really make me feel comfortable it has a chance to follow-through. Billy

    Name:  Shakeout.gif
Views: 177
Size:  26.1 KB

  6. #6
    It is interesting that we reversed back up at 77.35, while the IWM robot was advising new longs at 77.45.
    This is not the first time that I notice how close the entry targets are from the reality.


    Pascal

+ Reply to Thread

Posting Permissions

  • You may not post new threads
  • You may not post replies
  • You may not post attachments
  • You may not edit your posts