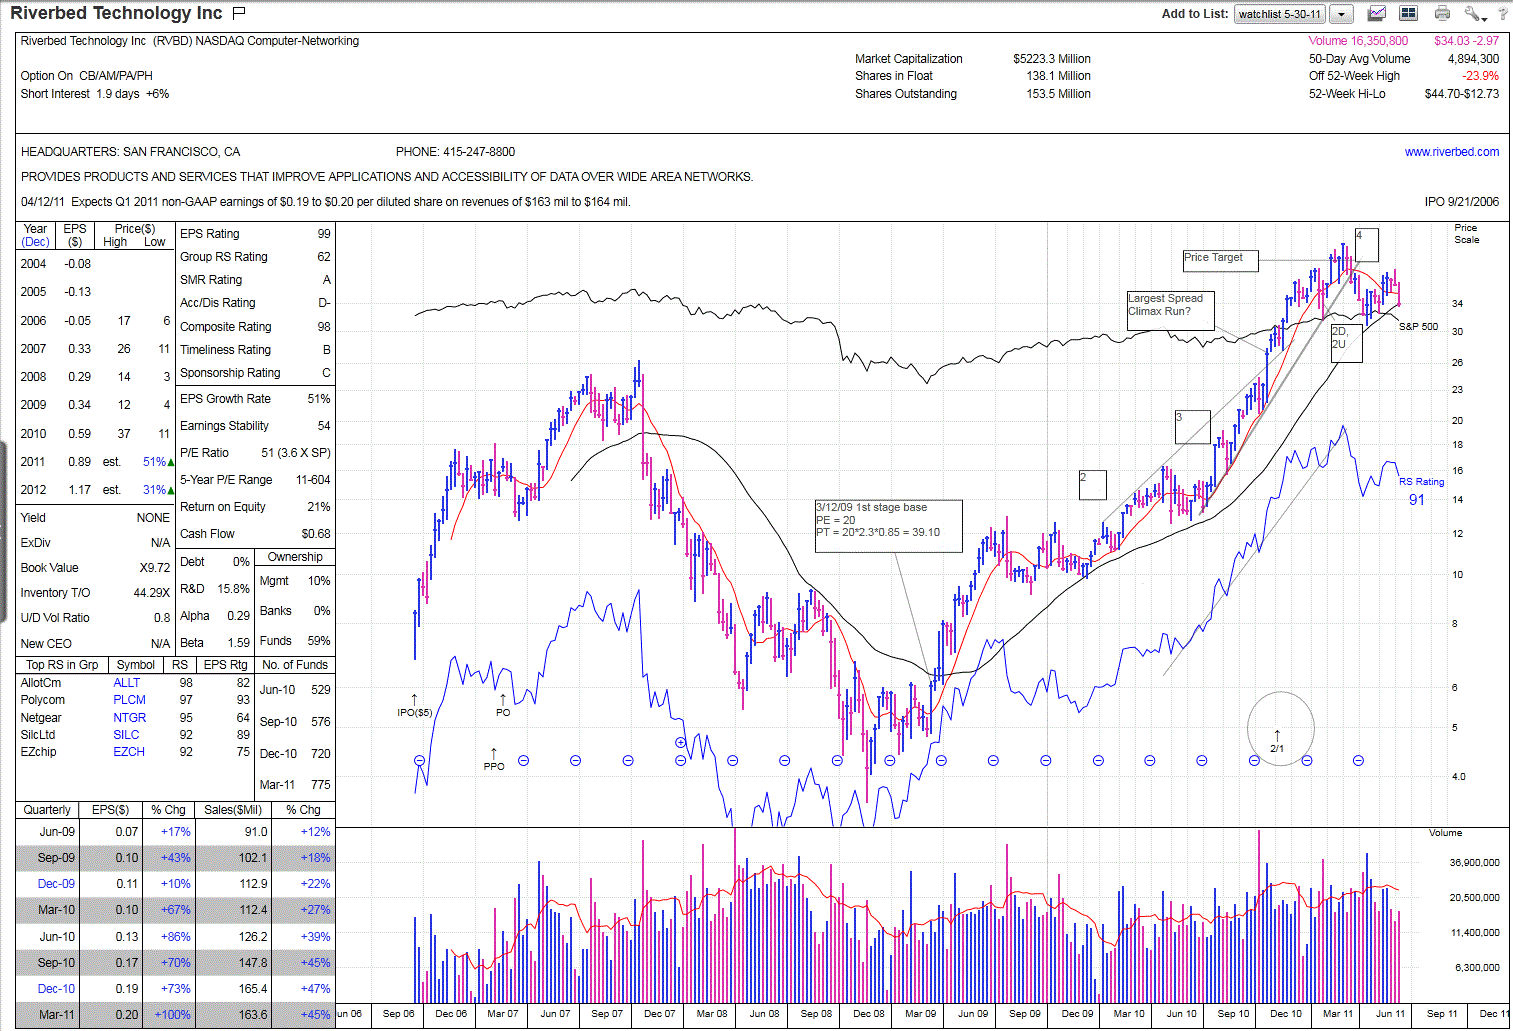
Review of RVBD, Chart reading Tutorial
Riverbed Technology Inc was an early leader from the 2009 market bottom. It broke out of a split adjusted price of $12.28 during the week of 3/13/09 when the general market was signaling a new uptrend. That was the first-stage base. The PE was 20 and the 2011 forward EPS estimate was 0.85 at the time. This leads to a 130% expanded PE price target of $39.10. RVBD went on and formed a second, third and is in a 4th stage base stucture now. 3rd and 4th stage bases are called late stage bases. By the time they are formed they are on everybody's radar screen and investors that want to be in are in already. It is difficult then to find new money to come into the stock, often the late comers rush in at the end causing climactic price activity as new buyers become exhausted.
RVBD broke an upper trend line the week of 10/22/10 with a weekly spread being the largest price spread since the beginning of its run. Breaking upper trend lines and having largest spreads are potential climactic activity. RVBD had further to run however. Just prior to reaching its price target RVBD exhibited a weakness. On the chart it is labeled 2D, 2U. This means that RVBD weekly chart pattern exhibited two sharp down weeks followed by two up weeks closing at a new high. This is actually a weak pattern and stocks can be sold imediately on this pattern. RVBD shortly thereafter broke the computed price target and began an immediate correction which is where we are now. RVBD is now showing a possible head and shoulders topping pattern.
When too many leaders look like RVBD the leadership is out of gas which can cause the market to top. Too many topping late stage bases can be associated with an exhausted bull market.
Mike Scott
Cloverdale, CA


 Reply With Quote