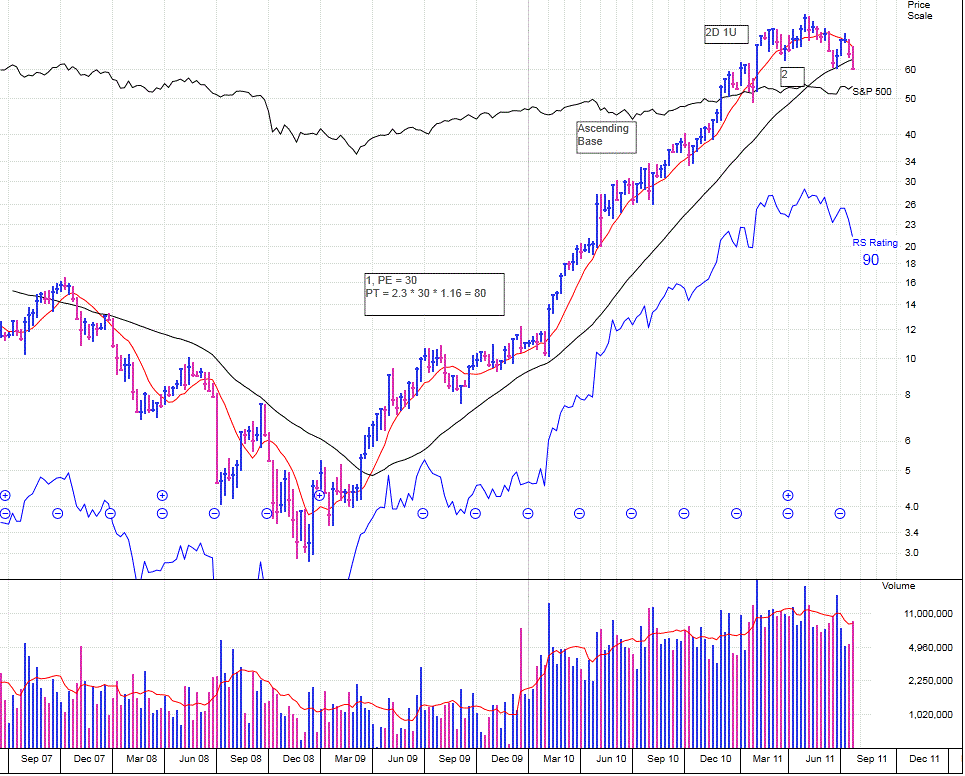
Lets look at the APKT chart.

I computed a price target based on the well formed base just above $10 in 2009. The PE was 30 at the breakout and at the time forward estimated earnings in 2011 were $1.16 as they still are. Using 130% PE expansion this yields a price target of $80, this is not an exact science. It looks to me like APKT has topped out at $84.50 approximately where I would expect it to. I suspect the large weekly spread week of Feb 4 was a climax run. APKT made a new base after the climax run and broke out. It failed that breakout when it dropped below the 10-week line four weeks later.
I marked something on the chart "2D, 1U". This means 2-weeks down, 1-week up to a new high. This is a weakness pattern. A quick substantial drop and quik rise to a new high without putting in the time to form a base of sufficient length is pattern that usually portends weakness and you can sell immediately when seeing this pattern after a sizeable advance like APKT has put in.
Now I can see that a head and shoulders pattern has been established and the 10-week line is acting as resistance. APKT belongs on a short-position watch list for such time in the future it rallies back into the 10-week line. The last rally up to the 10-week showed an LEV divergence. The price rallied and Large EV stayed flat. I believe using EV in this way helps identify weak rallies into resistance that are likely to be turned back.
Mike Scott
Cloverdale, CA


 Reply With Quote