
Originally Posted by
happy

Billy, first off ... thank you so much for your daily and intraday commentary ... it is GREATLY appreciated!
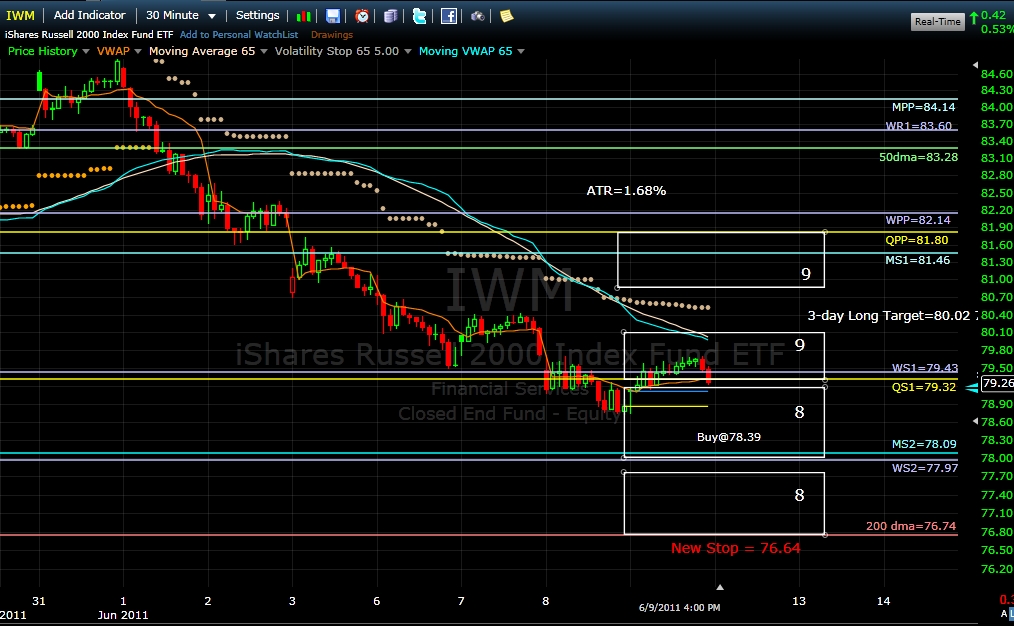
question for you ... from a discretionary perspective ... looking at the multi-timeframe pivots would imply we have much stronger resistance than support at the robot's limit price. I'm wondering again why the discrepancy. Is the pivot methodology a shorter term time frame (i.e. today is bearish, but the next three days are bullish) OR are you in a sense ignoring the pivot confluence levels and looking more so at the r/r ratio for the robot trade this time around?


 Reply With Quote


