Make sure to read Pascals comments for both robots. The GDX Robot is now in cash and not looking to enter any new position, so lets quickly examine IWMs cluster outlook.
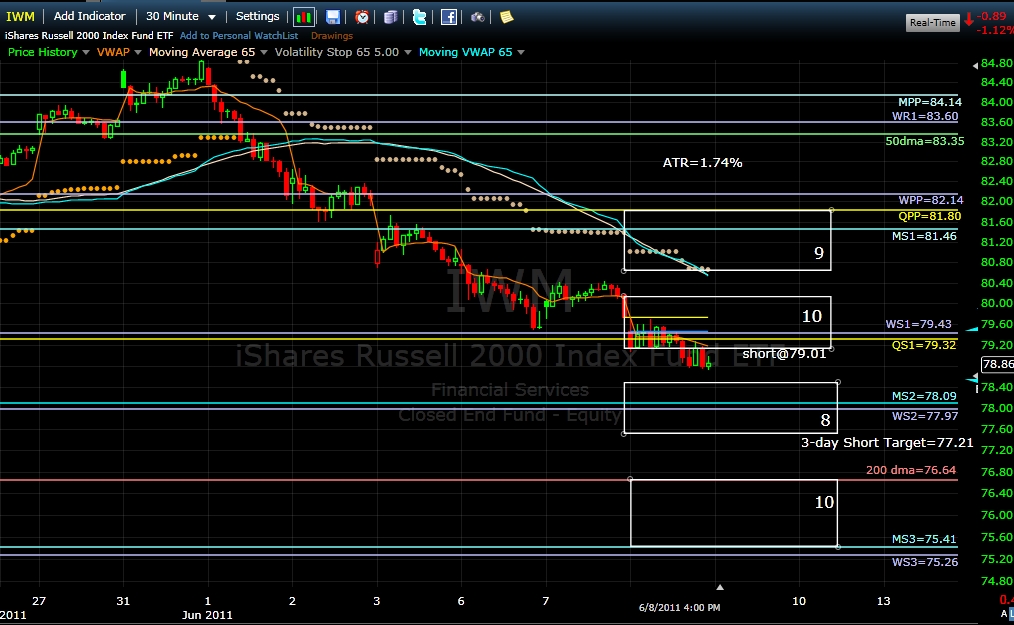
The path of least resistance is to the downside and with some growing fear winds in its back, IWM could test the 200-day moving average as early as today.
If a gap down follows the Jobless Claims report, expect some intraday consolidation around MS2 (78.09) and WS2 (77.97), quite similar to the one seen yesterday around WS1 and QS1.
A gap up with some following strength would hint that a short term bottom is possibly in the making around QS1 (79.32). A close at or above 79.32 remains an important required confirmation for the bullish case.
Billy
Attachment 8701


 Reply With Quote
