+ Reply to Thread
Page 1 of 2 1 2 LastLast
Results 1 to 10 of 11

Thread: Road Map for June 8, 2011

  1. #1
    Join Date
    Dec 1969
    Location
    Brussels, Belgium
    Posts
    1,999

    Road Map for June 8, 2011

    Judging by the pre-market activity, IWM may gap down today just under QS1 (79.32). For my expectation from yesterday’s debriefing to prove correct, we should see a quick bounce above QS1 (79.32) and WS1 (79.43) and a gap fill before an easy assault of the first weak resistance cluster.
    After five days of decline, institutional buy orders to execute “at best” in the next few days must have piled in and waiting inside market makers books. A fast spooky shake-out move to fish for the latest stops often precedes the start of a new buying wave. If we see no up-reversal and down-gap fill within 1 hour after the opening, then my scenario will likely be wrong and a proof that no large players are really interested to buy and they prefer to wait for a test of the rising 200-day moving average (76.55). However a first support strength of 13 vs. a first resistance strength of 4 within 1 ATR range offers all necessary and favorable conditions for a reversal and bounce. Note that both SPY and QQQ do offer the same kind of opportunity today and the move could become powerful.

    Name:  iwm110608.jpg
Views: 335
Size:  339.8 KBName:  spy110608.jpg
Views: 350
Size:  317.9 KBName:  qqq110608.jpg
Views: 340
Size:  292.0 KB


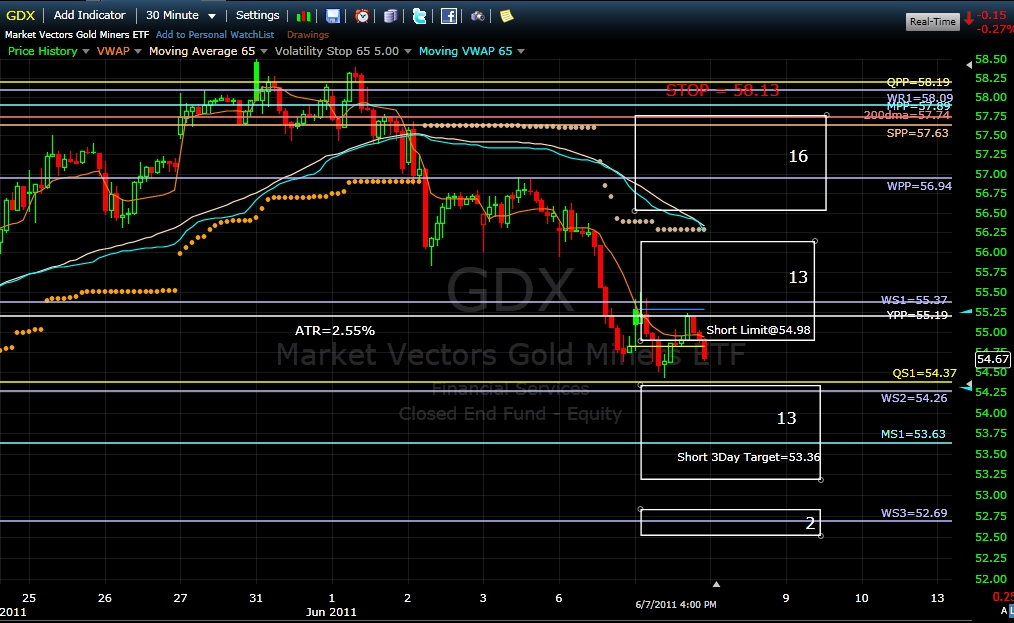
    GDX is still stuck within two clusters of equal strength and hints at no clear directional move today besides a continuation of its current bearish bias.

    Name:  gdx110608.jpg
Views: 340
Size:  333.0 KB

  2. #2

    Road Map

    Billy,

    Great review.

    A little off topic, but any ideas why the CBOE Implied Correlation indices are so somnolent? Same for the VIX. One would think they'd be showing a bit more pep at this point.

  3. #3
    Join Date
    Dec 1969
    Location
    Brussels, Belgium
    Posts
    1,999
    Quote Originally Posted by adam ali View Post
    Billy,

    Great review.

    A little off topic, but any ideas why the CBOE Implied Correlation indices are so somnolent? Same for the VIX. One would think they'd be showing a bit more pep at this point.
    Adam,

    I've stopped using the VIX as a consistent meaningful indicator long ago, whatever everybody else is trying to prove me.
    I have no clue about the correlation indices. I watch them flashing false signals without any consequences anymore. So I've stopped writing about them, just as English Bob.
    These indicators (VIX and all) are all derived from the option market and are not reflecting the true state of the underlying stock market anymore, because too many sophisticated strategies are widespread and can skew the classic interpretations.
    Billy

  4. #4
    Billy: Do you use 5 day for calculating ATR? I am almost positive that you use 5 day, but wanted to make sure.

    Thanks.

  5. #5

    Vol indices

    Thanks. Obviously, I'm trying to decipher current status of fear/greed among investors through these or other indices. It seems tougher to do these days.

  6. #6
    Join Date
    Dec 1969
    Location
    Brussels, Belgium
    Posts
    1,999
    Quote Originally Posted by Sandy View Post
    Billy: Do you use 5 day for calculating ATR? I am almost positive that you use 5 day, but wanted to make sure.

    Thanks.
    Sandy,

    As a rule of thumb, 20-day ATR using an exponential moving average is what works best for most securities. Billy

  7. #7
    Join Date
    Dec 1969
    Location
    Medford, OR USA
    Posts
    24
    Quote Originally Posted by Billy View Post
    Adam,

    I've stopped using the VIX as a consistent meaningful indicator long ago, whatever everybody else is trying to prove me.
    I have no clue about the correlation indices. I watch them flashing false signals without any consequences anymore. So I've stopped writing about them, just as English Bob.
    These indicators (VIX and all) are all derived from the option market and are not reflecting the true state of the underlying stock market anymore, because too many sophisticated strategies are widespread and can skew the classic interpretations.
    Billy
    Hi Billy,
    Are there any available inverse gold minersw ETFs that I could use rather than short GDX when the GDX robot gives a short signal?

  8. #8
    Join Date
    Dec 1969
    Location
    Brussels, Belgium
    Posts
    1,999
    Quote Originally Posted by slgerritz View Post
    Hi Billy,
    Are there any available inverse gold minersw ETFs that I could use rather than short GDX when the GDX robot gives a short signal?
    DUST, the double inverse gold miners ETF, is the only one I am aware of.
    It is highly illiquid and only adequate for small limit orders.
    Billy

  9. #9
    I updated the 20DMF. We can see that some money is moving in. However, the imoprtant data is that the OB/OS signal is now still more OS, down to -87. There is settings on the 20DMF that closes short positions when the OS condition reaches -90, because the probability of a bounce from -90 is maximum based on the past three years data (even during the worst of the market crash).

    I closed my TZA long (short on the market).

    I will now closely look at the sectors with the worst price RS and see if shorts start covering their position.


    Pascal

  10. #10
    Join Date
    Dec 1969
    Location
    Brussels, Belgium
    Posts
    1,999

    Noon Update

    Key for the next swing direction will be a decisive breakout or breakdown from the opening 30-minute trading range (79.07-79.72). At this oversold stage, I think it is as simple as that. Billy

    Name:  iwm110608c.jpg
Views: 232
Size:  286.8 KBName:  iwm110608b.jpg
Views: 285
Size:  354.6 KB

+ Reply to Thread

Posting Permissions

  • You may not post new threads
  • You may not post replies
  • You may not post attachments
  • You may not edit your posts