-
I have not posted this for some time, although it's available in the daily dashboard worksheet in the shared Dropbox:
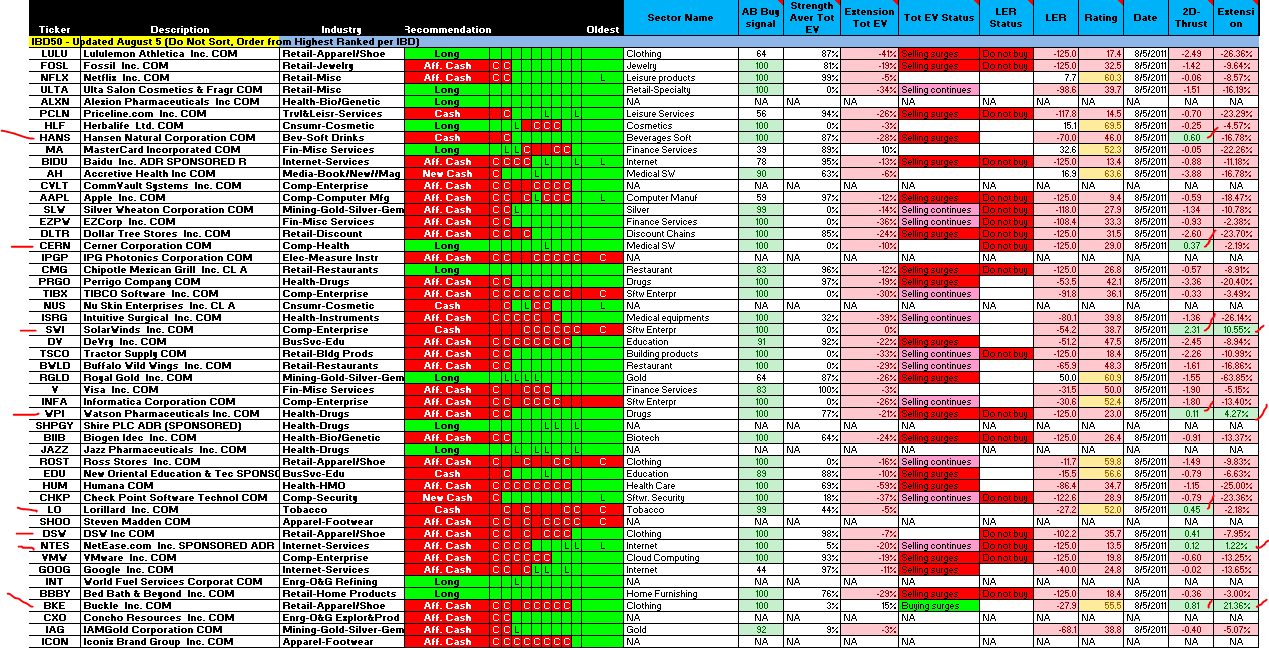
Most of these are below their historical outperformance levels and on a pure GGT basis, have not started to move upward. Those that are ranked "long" are above their historical levels but a quick check of money flow shows that most money is exiting, so I would anticipate a further drop in price and a move to "cash" for these stocks.
Although most of these have poor EV chart patterns, I am watching the 2d thrust and extension values, as combined positive movement here could show early emergence if we decide to rally. BKE is one such candidate, but as you might imagine, there are few to choose from off the IBD 50 list.
Regards,
pgd
 Posting Permissions
- You may not post new threads
- You may not post replies
- You may not post attachments
- You may not edit your posts
Forum Rules


 Reply With Quote