-
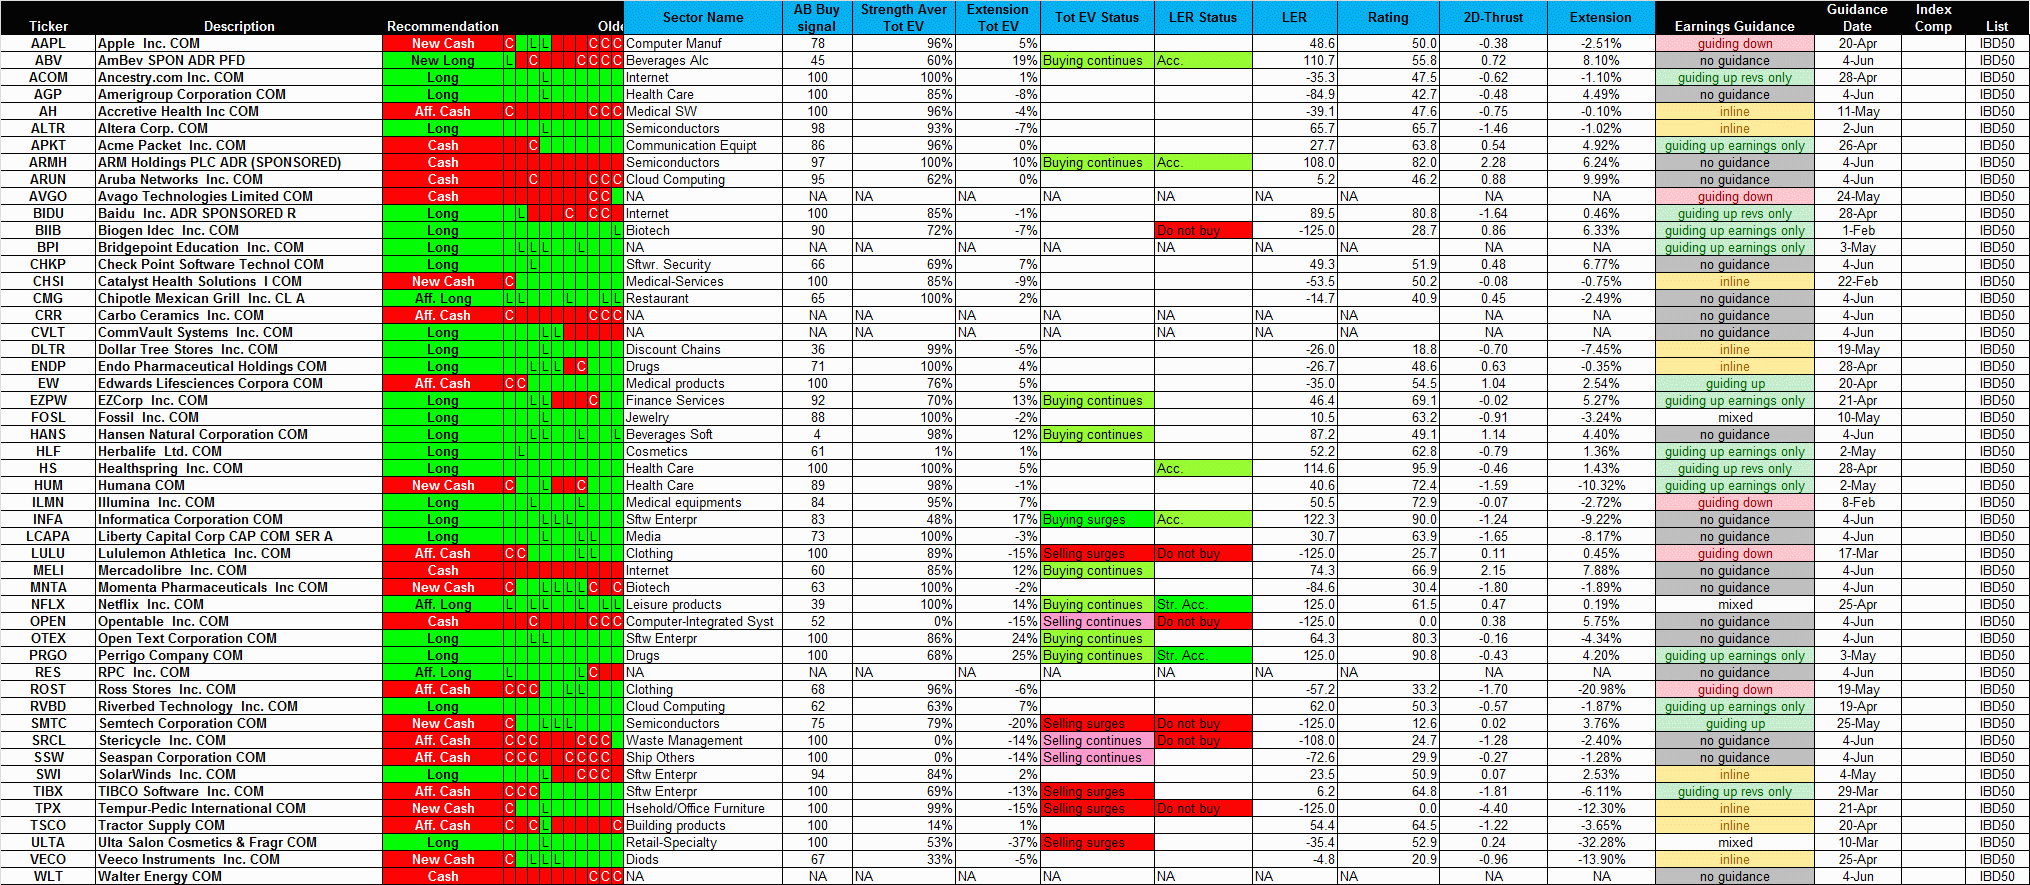
GGT + EV + IBD50 Matrix
In my weekly analysis, this chart is an intermediate step in my overall sequence, so I thought I'd start posting it here for the CANSLIM readers.
Refer to the image below. Right-click on it to open in a new tab or to save to your disk.
On the left we have the symbols, sorted alphabetically.
The left area of the table is the GGT recommendations of the IBD50 stocks. Generally, if "red", caution is advised, and if "green", chances are that it's outperforming its historical averages.
In the middle is Pascal's EV snapshot of the IBD50.
On the right is what Briefings.com has to say in terms of earnings guidance for the specific stock. Note that carrying any of these stocks across earnings announcement dates is dangerous, and it's more likely that if the stock is "guiding down" that you probably shouldn't even attempt to carry across an announcement.
Regards,
pgd
Here's the file for your own manipulation; you'll have to unzip it first. Load into Excel for the best performance: 11JUN03-GGT+EV-IBD50.zip

Last edited by grems8544; 06-05-2011 at 03:34 PM.
 Posting Permissions
- You may not post new threads
- You may not post replies
- You may not post attachments
- You may not edit your posts
Forum Rules


 Reply With Quote