


From back-testing, it worked better that way: same weight for each sector.Originally Posted by TraderD

Pascal


From back-testing, it worked better that way: same weight for each sector.
Pascal
You have two sets of three figures one for long trades and one for short trades). Each set evaluates both the 10D and 3D potential earnings, the R/R and the probabilities. The robot first looks at the LT edges. if it is strong enough it takes the trade. If not, then the robot looks at the short edge. If it finds something -even the slightest edge, - the robot takes the trade.
When the decision to take the trade is taken, then the robot has to decide on an entry point and on a stop loss. This is where the Multi time frame pivots come with the 1:3 RR ratio. The RR ratio is not a probability. It is the best entry level that will allow you to earn three times more than what you could lose on the trade, based on the pivots analysis only (and on back-tests.)
Pascal
Thanks, Pascal. Very helpful
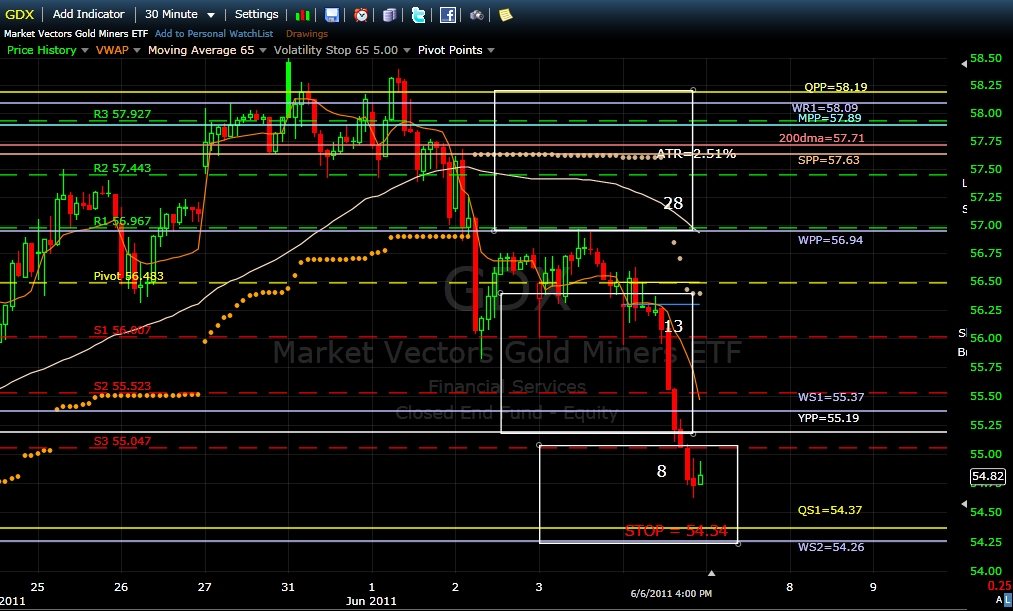
The current price of GDX as I write is $54.76. This is pretty well below the new entry price of$54.86 and getting close to the original stop of $54.34. I am little uncertain here as to what I should do now. Should I wait until the original stop is triggered and sell all or buy more now and ignore the orginal stop and rely on the new stop? How will either effect my odds?
Steve
If you took the original GDX trade, your stop loss might execute today and the trade will be a "wash". It is not because you are close to the past entry that the trade dynamics is the same. It is not! The GDX robot is closer to a short than to a long signal. If a short is not triggered at the close, then the oversold situation could trigger a new long opportunity for tomorrow, with new pivots settings. So, you respect the stops and see tomorrow what the robot's stated direction will be.
Pascal
Thanks Pascal,
Steve
Back on Tuesday last week (May 31) before the latest drop started, I had made my own preliminary calculation of the IWM robot's likely entry price and came up with 84.94. This used the 50MA and SR1 at 85.46.
Once the robot's numbers were published and showed an entry of 85.10, I scratched my head a bit and found that the robot was using YR1 at 85.68 instead of SR1, leading to a higher entry price even though SR1 is certainly a strong pivot. So I put in my order at 85.13 and, of course, it never got filled. Had I gone to bed and left an order at my presumed entry price, it would have filled and I would be about 20% richer now :-). So of course I have analyzed this case a bit.
I know the details of the entry/exit price calculations are proprietary, and I know deeply the advantages of testing a consistent methodology as opposed to reacting to one-time events. But I would be interested in any analysis of "why did the robot choose YR1 instead of SR1" if that is possible. I just seemed a bit counter to my expectations, especially that SR1 is such a strong pivot level that should be able to form a resistance level on its own.
Thanks,
-Mike
Last edited by mklein9; 06-06-2011 at 06:23 PM.

Adam,
There is zero coincidence. The LT/ST probabilities are computed from historical performance of the various EV strategies under similar conditions and from the last closing price.
The 3:1 risk-reward ratio is computed from the pivot & floor cluster configuration.
Billy
IWM refused to explore the first stronger resistance cluster which was marked by the daily pivot (81.10) and missed the robot short entry limit (81.18), by a few cents before falling across most of the weaker first cluster support down to the lower limit support of daily S3 and WS1 ( both 79.43), just above QS1 (79.32). The last hour of trading never touched DS3 and WS1, a sign that market makers might be scaling back in from these levels, opening the way for a bounce on Tuesday. The most probable 3-day short target (79.82) was overshoot in the process, so a very short term low may be in.
GDX followed its path of least resistance with conviction, falling through 1 ½ weaker support clusters, ignoring the important Yearly pivot (55.19) along the way. The GDX robot issued a sell signal at the close, based on the GDX MF. The position will be covered at the open on Tuesday and the robot will search for entering a new short position. Billy
Hi Billy,
Thanks for the link to this excellent SPY spreadsheet.
Is there also a link to an IWM spreadsheet ?
Trev
 Posting Permissions
 Reply With Quote