+ Reply to Thread
Page 1 of 4 1 4 LastLast
Results 1 to 10 of 37

Thread: GDX and IWM Cluster Strengths for June 6, 2011

  1. #1
    Join Date
    Dec 1969
    Location
    Brussels, Belgium
    Posts
    1,999

    GDX and IWM Cluster Strengths for June 6, 2011

    Let’s start with GDX where the cluster structure confirms the weak (neutral) long signal from the GDX Robot. The first resistance cluster is extremely strong at 28 and begins with the Weekly Pivot (56.94) up to Quarterly Pivot (58.19). Two of the strongest resistance levels are included, the 200 dma (57.71) and the Semester Pivot (57.63). The end-of May attempt of breaking above QPP - and the same strong cluster- failed and one can observe how quickly the decline accelerated once SPP was crossed to the downside. This is typical of organized distribution by large players and the vicinity of the 200 dma suggests that they were institutional players rather than market makers. Since there are only daily levels (not shown) just below Friday’s close, these are most likely to plan for re-accumulation for their own accounts around Yearly Pivot (55.19) which is clustering with WS1 (55.37). Hence their long targets will be the next weekly resistances levels: WPP (56.94), then WR1 (58.09) near the highs of the cluster. Watch for early rejection with volume at SPP (57.63) for the first hints that institutions are launching a new sell program. Once above that powerful cluster, the sky is blue with strong support and very weak resistance.

    Name:  GDX110606.jpg
Views: 303
Size:  315.4 KB

    The optimal buy point for a new entry is at 55.82 and downside risk will be limited by the floor WS1 (55.37) and YPP (55.19) supports. The most probable 3-day target from such an entry is at 57.33, just under the infamous Semester pivot. Notice how the trailing stop for the existing robot long position (54.34) is ideally placed, just below QPP (54.37) and just above the initial entry price (54.31).
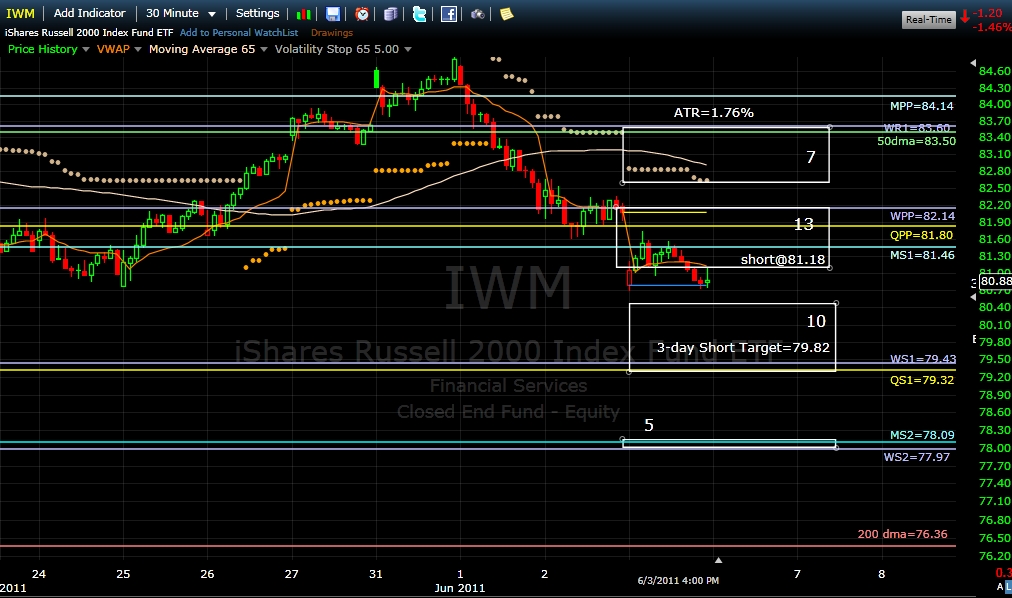
    For IWM, the path of least resistance is still to the downside. Here too, there are only daily floor levels (not shown) before the bottom of the first support cluster around Weekly S1 (79.43) and Quarterly S1 (79.32). Market makers have no vested interest currently to accumulate new long positions or cover short positions above that area, so any bounce into the first stronger resistance cluster can logically be shorted. The new short entry price of 81.18 is close enough to have a chance to be hit early on Monday just before strong resistance will appear at Monthly S1 (81.46) and Quarterly Pivot (81.80). In fact, from a standalone multi-pivots perspective, a new short entry will be safe as long as Monday’s close is below Weekly Pivot (82.14). And the robot statistics and probabilities give us a most probable 3-day short target of 79.82 just above the next potential consolidation area (WS1 and QS1). A further breakdown below QS1 (79.32) will find only very weak support around Monthly S2 (78.09) and Weekly S2 (77.97) and the 200 dma (76.36) will most likely become the next support and potential bottom area for this correction.
    As a side note, IWM closed for the first time in a “Strong Decline” daily stage since the summer of 2010, which is pointing to a capitulation selling wave soon.
    Billy

    Name:  IWM110606.jpg
Views: 355
Size:  325.9 KB
    Last edited by Billy; 06-05-2011 at 11:29 AM.

  2. #2
    Join Date
    Dec 1969
    Location
    Medford, OR USA
    Posts
    24

    IWM Robot Question

    In the IWM Robot Page "Management of existing positions" sections it states that the position was covered on 5/27/2011. It further says that the robot is currently looking for a short position. This seems clear; however in the "Settings for new positions" section it states that there is a short enty recommendation at $81.18 for the trade day following 6/3/2011. If I covered per the robot do I then assume the $81.18 is the new robot short signal and that the robot is no longer searching for a new short position?

    Additionally, in the "These are the probabilities for combine long term / short term setting:: section it states that "Today's SHORT setting are Neutral". Does this reference the $81.18 new position price?

    And the last question for now: Is the same page I wil view after subscribing to the new robot and what time of day will it be updated?
    Steve
    Last edited by slgerritz; 06-05-2011 at 03:55 PM.

  3. #3
    Join Date
    Dec 1969
    Location
    Vienna, Virginia
    Posts
    603
    Quote Originally Posted by slgerritz View Post
    If I covered per the robot do I then assume the $81.18 is the new robot buy signal and it is no longer searching for a short position?
    Steve
    $81.18 is the new robot buy signal for Monday, June 6th.

    The robot, since it is NOT in the position, is still searching. It's a terminology issue; the target entry is 81.18 on the SHORT side, e.g., "sell short" to enter.

    Regards,

    pgd

  4. #4
    Join Date
    Dec 1969
    Location
    Medford, OR USA
    Posts
    24
    Quote Originally Posted by grems8544 View Post
    $81.18 is the new robot buy signal for Monday, June 6th.

    The robot, since it is NOT in the position, is still searching. It's a terminology issue; the target entry is 81.18 on the SHORT side, e.g., "sell short" to enter.

    Regards,

    pgd
    Thanks Paul - Here's another question.

    The "These are the probabilities for the combined Long term / Short term settings:" section is as follows:

    Today's SHORT settings are NEUTRAL.
    The LT algo found a short edge of -1.25%. This is lower than the -0.75% limit
    The ST algo found a relatively weak negative edge of -1.59%
    The LT edge is more positive than -2%. In the past this combination led to a 3D short LOSS of -0.11% from the previous day's close. The trade became positive after three days in 53.1% of the cases.

    It appears that the more negative the number --- the more positive the return potential. Am I reading this correctly? Also is a NEUTRAL for the short setting saying that I do not have very good odds at making a gain. How does the built-in Multi Pivot 1/3 risk return ratio factor in to the robot signals?

  5. #5
    Quote Originally Posted by slgerritz View Post
    Thanks Paul - Here's another question.

    The "These are the probabilities for the combined Long term / Short term settings:" section is as follows:

    Today's SHORT settings are NEUTRAL.
    The LT algo found a short edge of -1.25%. This is lower than the -0.75% limit
    The ST algo found a relatively weak negative edge of -1.59%
    The LT edge is more positive than -2%. In the past this combination led to a 3D short LOSS of -0.11% from the previous day's close. The trade became positive after three days in 53.1% of the cases.

    It appears that the more negative the number --- the more positive the return potential. Am I reading this correctly? Also is a NEUTRAL for the short setting saying that I do not have very good odds at making a gain. How does the built-in Multi Pivot 1/3 risk return ratio factor in to the robot signals?
    The LT and ST edges are measured by comparing both Short and Long settings. The more negative the edge, the stronger a short position will be. The Multi-Pivots 1/3 RR ratio is one of the elements in the decision process.


    Pascal

  6. #6
    Join Date
    Dec 1969
    Location
    Vienna, Virginia
    Posts
    603
    Quote Originally Posted by slgerritz View Post
    It appears that the more negative the number --- the more positive the return potential. Am I reading this correctly?
    If we are looking for a short entry, then yes, your interpretation is correct.

    Quote Originally Posted by slgerritz View Post
    Also is a NEUTRAL for the short setting saying that I do not have very good odds at making a gain.
    My interpretation is that your chances of winning the position are less than if the signal is showing a STRONG short setting. It can still work in your favor, BUT, review the FAQ, specifically the charts that show the R/R as you move further from the original entry signal. The graphs clearly show that days since signal result in lower gains ....

    Quote Originally Posted by slgerritz View Post
    How does the built-in Multi Pivot 1/3 risk return ratio factor in to the robot signals?
    I have to defer this to the masters ... I can't clearly answer this from my study of individual FAQs.

  7. #7
    Join Date
    Dec 1969
    Location
    Medford, OR USA
    Posts
    24
    Quote Originally Posted by grems8544 View Post
    If we are looking for a short entry, then yes, your interpretation is correct.


    My interpretation is that your chances of winning the position are less than if the signal is showing a STRONG short setting. It can still work in your favor, BUT, review the FAQ, specifically the charts that show the R/R as you move further from the original entry signal. The graphs clearly show that days since signal result in lower gains ....

    I have to defer this to the masters ... I can't clearly answer this from my study of individual FAQs.
    Thanks Paul. I feel like I'm on a role now, so maybe I can get away with one more question for now.

    The 20 DMF chart has given a short signal. It uses the S&P 500 as part of the graph. Do I use this chart to either buy,cover or short the the S&P 500 (broad market) or can I assume it should be viewed as factor when trading the leader list? I will save my upcoming ETF questions for latter.
    Thank ahead of time.
    Steve

  8. #8

    Iwm ms1 & qs1

    Billy; The MS1 of 81.46 and QS1 of 79.32 seem based on the MPP from May and the QPP of the 1st quarter.
    Do you switch to June prices and prices from the 2nd quarter only on 7/1?

    Best regards,
    Robert

  9. #9
    Join Date
    Dec 1969
    Location
    Seattle, Washington USA
    Posts
    151

    Question about pivots and supports

    Billy--

    I think the analysis is fascinating. Until I joined this group I added daily support, resistance, and pivot points to my intra day 5-min chart of the SPY. I used these points to organize some day trading. I would find these everyday on the Prodigio trading platform at Think or Swim. I would also mark up my IWM charts in a similar manner.

    I wish to know: Do you publish the daily, weekly and quarterly pivots? I'd like to mark up my weekly and monthly charts similarly.

    If this question has been covered previously, my apologies.

    In any case, thank you very much for your efforts,

  10. #10
    Join Date
    Dec 1969
    Location
    Brussels, Belgium
    Posts
    1,999
    Quote Originally Posted by brrim View Post
    Billy; The MS1 of 81.46 and QS1 of 79.32 seem based on the MPP from May and the QPP of the 1st quarter.
    Do you switch to June prices and prices from the 2nd quarter only on 7/1?

    Best regards,
    Robert
    Robert,

    Sure. The pivot and floor levels are always derived from the previous period close. We still need the full data from June trading close both for new monthly, quarterly and semester levels, so they will change on 7/1.
    It is precisely such changes that allow progressive shifts of support/resistance clusters strengths over time leading to more or less hinderance to price progress. Near the end of any period, one can "cheat" and project the next period levels for some foresight. This exercise is most important at mid-year deadlines and I will comment on this in due time. Billy

+ Reply to Thread

Posting Permissions

  • You may not post new threads
  • You may not post replies
  • You may not post attachments
  • You may not edit your posts