


Billy--
Can you recommend books, articles or magazines to teach me about the actions of market makers and institutions?
My interest is as big as my ignorance.
Again, if this has been handled pre-EV Forum, my apologies.
Many thanks,

Billy--
Can you recommend books, articles or magazines to teach me about the actions of market makers and institutions?
My interest is as big as my ignorance.
Again, if this has been handled pre-EV Forum, my apologies.
Many thanks,

Nickola,Originally Posted by nickola.pazderic

I am unable to recommend anything, although I am sure some good stuff could be found by digging/googling deep enough.
Most of what is written is of no practical value, especially with market makers true actions. As i've written many times in the past, these are some of the best kept secrets because they are so lucrative.
All i've learned was from actual practice and experience in real life, being a former euro-bond and later NASDAQ market maker myself long before the job became all computer-driven. For example, I NEVER looked at a chart on my market maker screen, I was only interested in the spreadsheets of my clients' and my own inventories' average weighted prices evolution for all timeframes. Like for all market makers, it was all about scaling in and out at each pivot & floor level for each timeframe. The big money was made with the longest timeframes inventories and the ability to practice naked short-selling; pocket money came from the spreads between bid & ask prices.
That's how I came to the confluence/cluster concepts, trying to monitor the collective action of market makers. A lot is written about institutional investors accumulation/distribution, but it is actually executed by market makers with their own techniques and conflicts of interest.
Billy
Billy,
On the Robot page it states:
These are the probabilities for the combined Long term / Short term settings:
Today's SHORT settings are NEUTRAL.
The LT algo found a short edge of -1.25%. This is lower than the -0.75% limit
The ST algo found a relatively weak negative edge of -1.59%
The LT edge is more positive than -2%. In the past this combination led to a 3D short LOSS of -0.11% from the previous day's close. The trade became positive after three days in 53.1% of the cases.
How do these probabilities coincide with the 3:1 risk reward probability you mention above?

The Robots uses the 3:1 risk rewrads and the potential earnings to decide on a short/long position (it compares first the LT edges and then the ST edges).
I have incldued additional statistics so that investors can see what the combination of the LT/ST combination did in the past. This allows to size your position. The robot does not take these into consideration.
Pascal
I think I may be mixing up timeframes.
So far as I understand, the Robot page statistics indicate, based on historical data, what the likelihood is for gain/loss over the next 3-day period. The greater the probability of gain, the larger the position size, all other things being equal.
In conjunction with this shorter timeframe probability, I am to assume so long as the Robot is providing an entry point for that day the trade holds (at least) a 3:1 RR probability with the proviso one enters the trade at the price point given.
You have two sets of three figures one for long trades and one for short trades). Each set evaluates both the 10D and 3D potential earnings, the R/R and the probabilities. The robot first looks at the LT edges. if it is strong enough it takes the trade. If not, then the robot looks at the short edge. If it finds something -even the slightest edge, - the robot takes the trade.
When the decision to take the trade is taken, then the robot has to decide on an entry point and on a stop loss. This is where the Multi time frame pivots come with the 1:3 RR ratio. The RR ratio is not a probability. It is the best entry level that will allow you to earn three times more than what you could lose on the trade, based on the pivots analysis only (and on back-tests.)
Pascal
Thanks, Pascal. Very helpful
Back on Tuesday last week (May 31) before the latest drop started, I had made my own preliminary calculation of the IWM robot's likely entry price and came up with 84.94. This used the 50MA and SR1 at 85.46.
Once the robot's numbers were published and showed an entry of 85.10, I scratched my head a bit and found that the robot was using YR1 at 85.68 instead of SR1, leading to a higher entry price even though SR1 is certainly a strong pivot. So I put in my order at 85.13 and, of course, it never got filled. Had I gone to bed and left an order at my presumed entry price, it would have filled and I would be about 20% richer now :-). So of course I have analyzed this case a bit.
I know the details of the entry/exit price calculations are proprietary, and I know deeply the advantages of testing a consistent methodology as opposed to reacting to one-time events. But I would be interested in any analysis of "why did the robot choose YR1 instead of SR1" if that is possible. I just seemed a bit counter to my expectations, especially that SR1 is such a strong pivot level that should be able to form a resistance level on its own.
Thanks,
-Mike
Last edited by mklein9; 06-06-2011 at 06:23 PM.
Adam,
There is zero coincidence. The LT/ST probabilities are computed from historical performance of the various EV strategies under similar conditions and from the last closing price.
The 3:1 risk-reward ratio is computed from the pivot & floor cluster configuration.
Billy
IWM refused to explore the first stronger resistance cluster which was marked by the daily pivot (81.10) and missed the robot short entry limit (81.18), by a few cents before falling across most of the weaker first cluster support down to the lower limit support of daily S3 and WS1 ( both 79.43), just above QS1 (79.32). The last hour of trading never touched DS3 and WS1, a sign that market makers might be scaling back in from these levels, opening the way for a bounce on Tuesday. The most probable 3-day short target (79.82) was overshoot in the process, so a very short term low may be in.
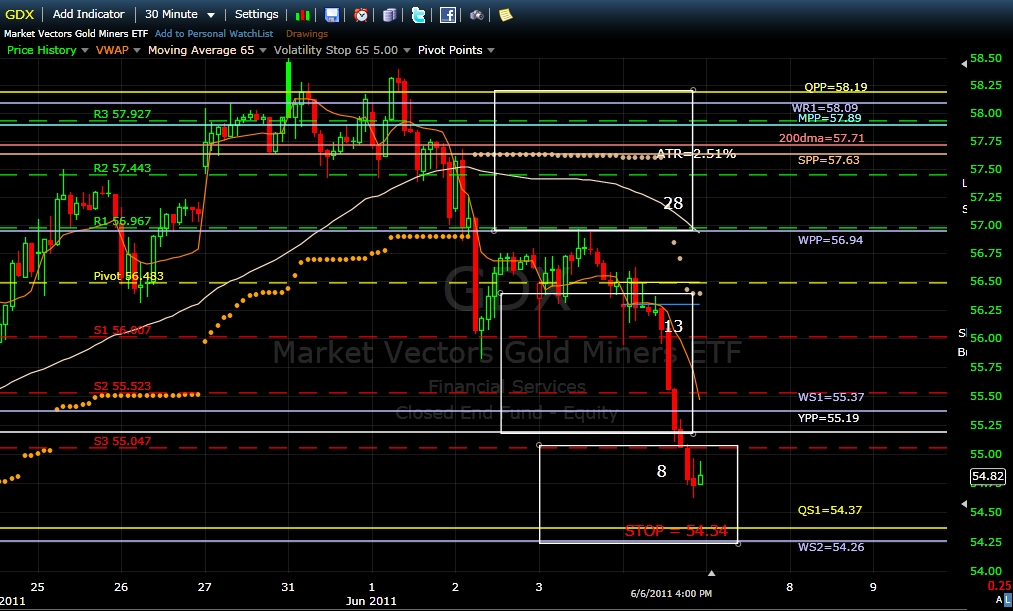
GDX followed its path of least resistance with conviction, falling through 1 ½ weaker support clusters, ignoring the important Yearly pivot (55.19) along the way. The GDX robot issued a sell signal at the close, based on the GDX MF. The position will be covered at the open on Tuesday and the robot will search for entering a new short position. Billy
 Posting Permissions
 Reply With Quote