-
Lopsided buying, then selling - an historical anomaly
Since TradeStation supplies bar by bar volume made on uptick vs downticks, it is relatively easy to manipulate these statistics. Below shows a 203 min. chart (cutting the day in half), with up - down volume in the subgraph and stdev bands with length 20 at 2 std devs. The current configuration of hitting the upper stdev band, then the lower one the next bar has only happened once in the last 10 years, over Nov 6 and 7, 2007. It happened in the reverse (down to up) 6 times. Though a small sample size overall, these reversals tend to get continuation in the direction of the second bar.
Update: 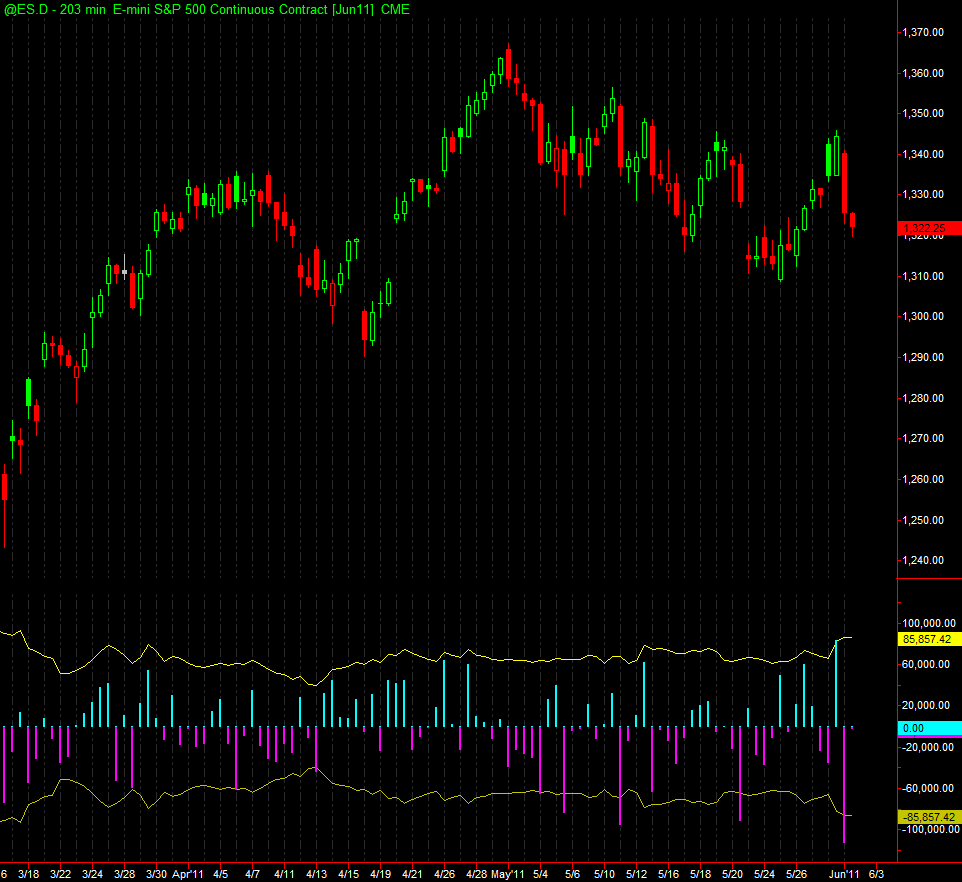
 Posting Permissions
- You may not post new threads
- You may not post replies
- You may not post attachments
- You may not edit your posts
Forum Rules


 Reply With Quote