+ Reply to Thread
Results 1 to 10 of 10

Thread: Tutorial: Setting Price Targets

Hybrid View

  1. #1
    Join Date
    Dec 1969
    Location
    Tarzana, CA
    Posts
    962

    Tutorial: Setting Price Targets

    This is an advanced topic.

    Historical studies of leading growth stocks show that starting from a new bull market cycle that leading growth stocks breaking out of their first base often top 18-months to 2+ years later. In CANSLIM investing we typically pay zero attention to P/E when we buy a stock. However we do make use of it to help determine if a stock is in a possible topping zone. Typically a growth stock expands it first-stage breakout P/E by 130% before it finally tops. Often 130% works well but this is not an exact science, in 1997 the top 10-percentile leaders expanded P/E by 318%. 1997 was an exceptional year.

    So the procedure is to first identify the first base breakout. We actually spend some time determining when institutions are entering and not just pick any base. Typically a breakout out of a base when the price is above $10 is in the institutional buying zone. 2009 was a strange year with institutional activity below this price. I look to see how many funds own a stock as well as inspect earnings and volume for obvious signs of institutional activity. Once I identify the instutional-quality first-stage breakout I determine the P/E at that time. I either have to find the prior 4-quarters of reported earnings per share to do this or use a shortcut of looking it up in an old financial newspaper. I keep all electronic copies of Inverstors Business Daily back to January 2003 for this purpose.

    Next step is to access future expected earnings estimates 18-months to 2-years out from that 1st stage base breakout. The price target is computed by adding 130% to the first-stage base P/E and then multiplying that figure by the estimated future annual earnings to achieve the target topping zone price. Multiplying the P/E by 2.3 is the same as adding 130% to the P/E...

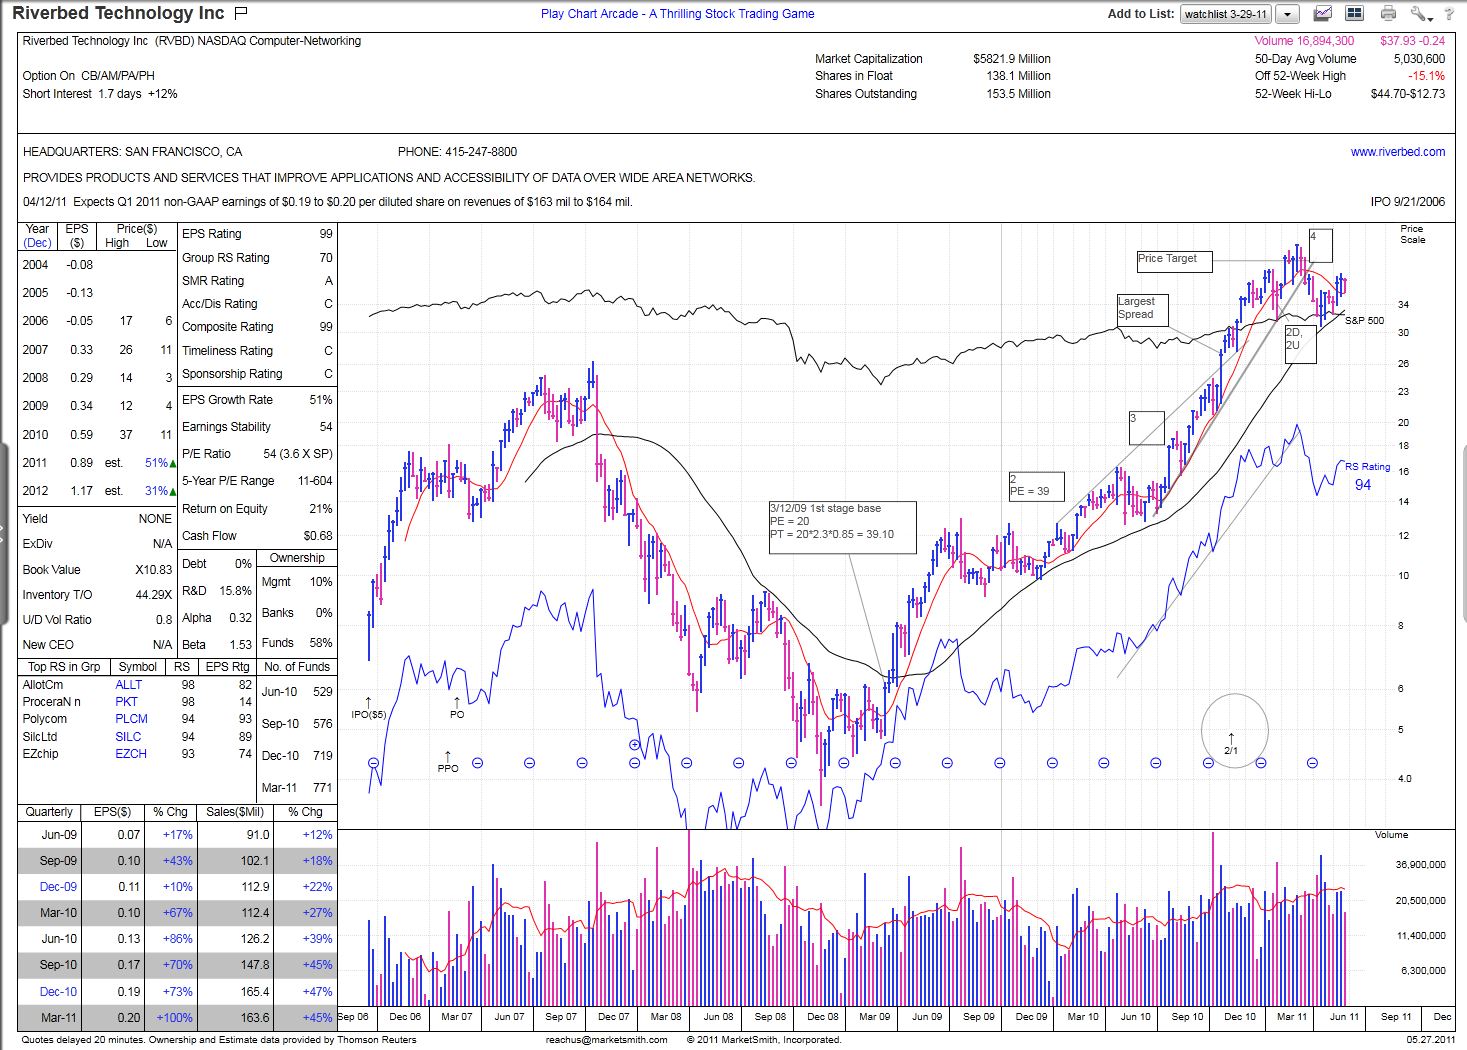
    So lets use an example with Riverbed Technology, symbol RVBD...
    The image below shows the chart and I have embedded the calculation on that chart. You may have to scroll your window to see the whole chart as it is pasted full size. I identified the first base breakout in March 2009. RVBD began its leadership at the same time that the general market signalled a new bull market. This chart shows RVBD price below $10 at this time but take note of the 2:1 split that happened in 2010, the price at the time was actually above $12. The computed price target was $39.10 using the then $0.85 forward EPS estimate in 2011. Since then the forward EPS estimate for 2011 has been increased to 0.89 which you can see on the left hand side of the chart in the data boxes for year 2011. I generally don't try to chase these numbers as they are modified but you can do so with a little bit of optimistic risk to your numbers.

    On the chart I marked with a line and a box the approximate 39.10 price target. You can see that RVBD penetrated this line by about 14% and began what looks to me like a possible topping process with a 4-th stage base. It could be forming a head and shoulders pattern now although I find a potential flaw in that reading as the down volume on the right side of the head may not be adequate for a reliable read.

    With knowledge of a future price target you can decide to have sticky fingers with a holding that you may have a substantial profit in with knowledge that the run up is probably not finished. Of course Mr. Market can and will have the final say on when the runup is done.

    I annotate charts like this for my own use. Right now I have 596 charts marked up in this fashion so that I don't forget important details.
    Name:  RVBD.JPG
Views: 418
Size:  311.2 KB
    Mike Scott
    Cloverdale, CA

  2. #2
    Join Date
    Dec 1969
    Location
    Montreal Quebec Canada
    Posts
    55

    A couple of questions

    First of all thanks for this excellent post. I am somewhat familiar with the CANSLIM approach but never was exposed to the idea of price projections within this discipline. I have my own "technical" approach to price targets but that is another story.
    Question 1: When you made your projection in 2009, where analysts clever enough to project 2.5 times earnings increased?
    Question 2: Are the estimates from IBES or another organization?
    Question 3: If these estimates are a distribution of many analyst estimates, do you take into account the variability around the mean estimate when you make your price projection.

  3. #3
    Join Date
    Dec 1969
    Location
    Tarzana, CA
    Posts
    962
    1. Was I clever enough to use the earnings projections at the time in 2009? Yes and no. I use the EPS projections at the time of the breakout of the first base if I am clever enough to do it at the right time. Often I notice a stock later in a sequence and I have no organized way to discover historical EPS projections so I use what I have. I am not sure but I suspect I calculated RVBD in late 2009 when the 2011 EPS estimate was 0.85 (it is currently 0.89)

    2. The EPS estimates are from Investor's Business Daily (IBD). You can see the estimates on the chart I pasted. The chart came out small and hard to read. If you save it to your desktop and open it you can read the fine print.

    3. Typically the EPS estimate equates to the mean of the estimates from other sources. I would have no problem uising the mean estimate from YAHOO Finance for example.

    Lastly this is not a sell rule, just an indication to pay closer attention to your real sell rules or perhaps passing one up if it appears that it may have already reached target. In the latter case my watchlist should not be full of stocks with limited upside potential. I am finding this to be the case right now as I try to prepare a watchlist. Many-many stocks seem to have fulfilled their upside potential.
    Mike Scott
    Cloverdale, CA

  4. #4

    Does QEx alter your calculations?

    Great post.

    Does the N in CANSLIM-- either due to internal forces such as occurred at Apple in the past decade or due to exogenous ones such as QE -- alter your projections and if so can you quantify how?

    Thanx in advance.

  5. #5
    Join Date
    Dec 1969
    Location
    Tarzana, CA
    Posts
    962
    Does QE effect the price target calculations?
    Not so far, but then we are not really done with QE yet. Instead we have seen a bit of rotation into other issues. Many stocks have neared or have hit their price target since the 2009 lows. Most of them look like they have topped with late-stage bases but with QE I don't rule out anything. The fact that many leading stocks look to have finished their run is a bearish situation in my opinion as we stare into a possible rally this week.

    One point I did not stress before is that this process is used for institutional quality stocks only. CANSLIM methods don't work well with cheap and thinly traded stocks and stocks with questionionable earnings.
    Mike Scott
    Cloverdale, CA

  6. #6
    Join Date
    Jan 1970
    Location
    Las Vegas, NV
    Posts
    172
    Hi Mike,

    Thanks for sharing all of your knowledge, which is very appreciated.

    Can you elaborate on some of the ways you use to determine "fixed stars" versus "comets"?

    By fixed stars, I am referring to stocks like ISRG, DECK, AAPL, BIDU, CMG, GMCR, etc.,

    By comets, I am referring to stocks like TASR, STEC, TIE, CROX, etc.,

    In other words, what types of criteria might be utilized to determine whether a growth stock has staying power and the possibility of minting profits with great consistency versus a stock that simply undergoes a brilliant rally followed by a slow and painful drift to the dustbins of the market?

    When viewing the chart of ISRG, the 2006 "top" was merely the start of a long consolidation before another major breakout in early 2007.

    Since CANSLIM focuses on 6-9 month rallies, do you simply monitor and track former leaders to determine a reset of the base count, whereby another significant move could take place?

    I ask because I at one point held GMCR and BIDU from standard CANSLIM buypoints, but did not possess the experience to determine some of the characteristics that set these companies apart, which would have allowed me to hold.

    I am curious if you can provide insight as to how you may handle "Big Stocks," and some criteria that is useful in making such a judgment.

    Best,

    Eric

+ Reply to Thread

Posting Permissions

  • You may not post new threads
  • You may not post replies
  • You may not post attachments
  • You may not edit your posts