-
MIDAS & TopFinder BottomFinder (TBF)
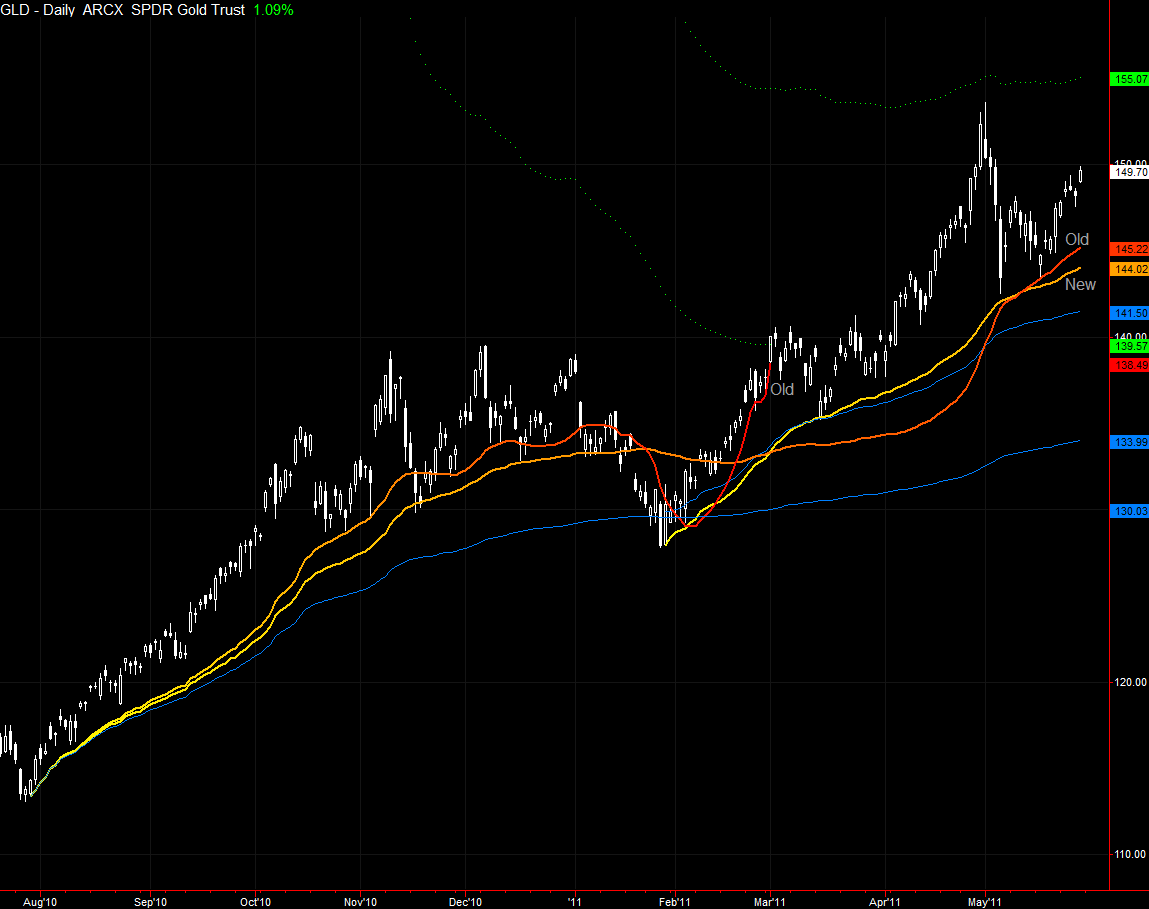
Mike requested a TBF chart for GLD in the eMini forum, but I thought it might be of interest to people here. I had not pulled this chart in several months.
Two TBFs were started from the Jul 29 low (D = 2,200,000,000 and 4,000,000,000). Interesting that after a pullback to the concurrently launched MIDAS curve (blue), the first TBF caught the beginning of a consolidation period, while the second has been recent support (79% complete).
A new TBF was launched from the Jan 28 low (D = 3,500,000,000). Strictly speaking, the pullback was probably too deep (close to the MIDAS curve) to be considered for a parabolic move. Yet, it has served as recent support, so I will keep it there (it is 36% complete). My guess is the older one is more important.
-
Thanks Bob. This is very interesting.
I just posted a Robot GDX Comment pointing out that the robot issued its last buy signal on May 12 and generated a paper gain of 6.6% since then.
Would you mind showing us also the same for silver?
Thanks
Pascal
-
Slv
SLV retraced too much to have an extant TopFinder--at least on the daily. There might be BottomFinder in play, which I'll look at tomorrow.
 Posting Permissions
- You may not post new threads
- You may not post replies
- You may not post attachments
- You may not edit your posts
Forum Rules


 Reply With Quote
