+ Reply to Thread
Page 4 of 5 FirstFirst 1 4 5 LastLast
Results 31 to 40 of 85

Thread: Market

Hybrid View

  1. #1
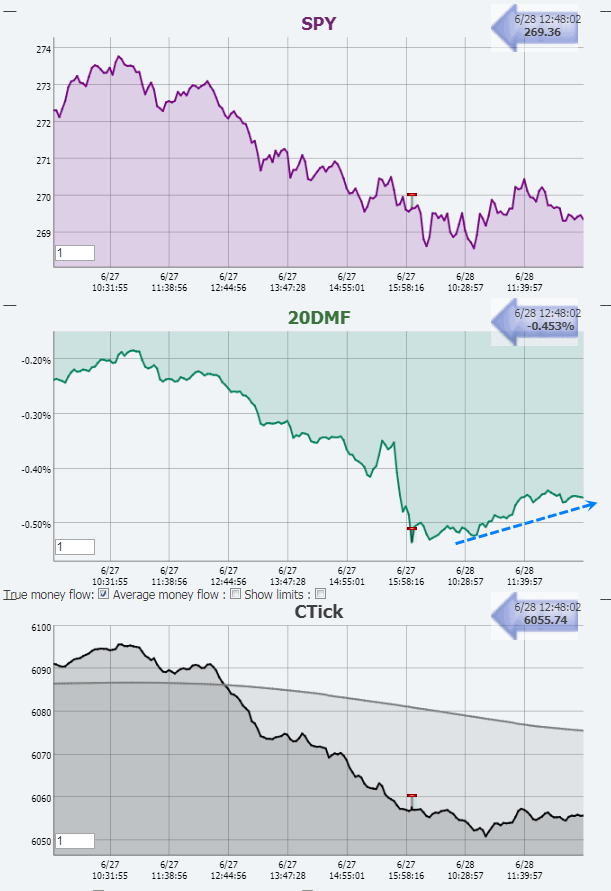
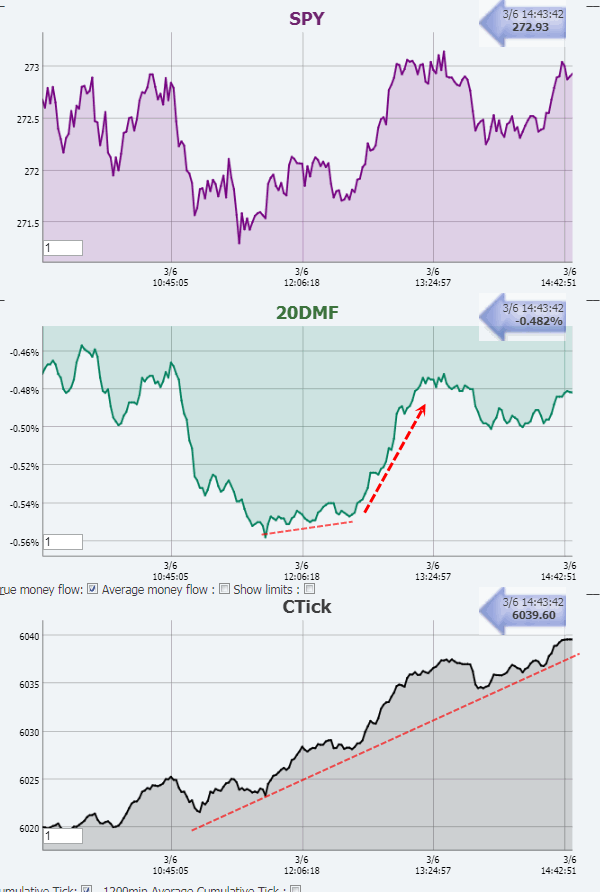
    Finally money came back in during lunch time and the day was saved.


    Pascal

    Name:  20DMF_RT.gif
Views: 1800
Size:  42.3 KB

  2. #2
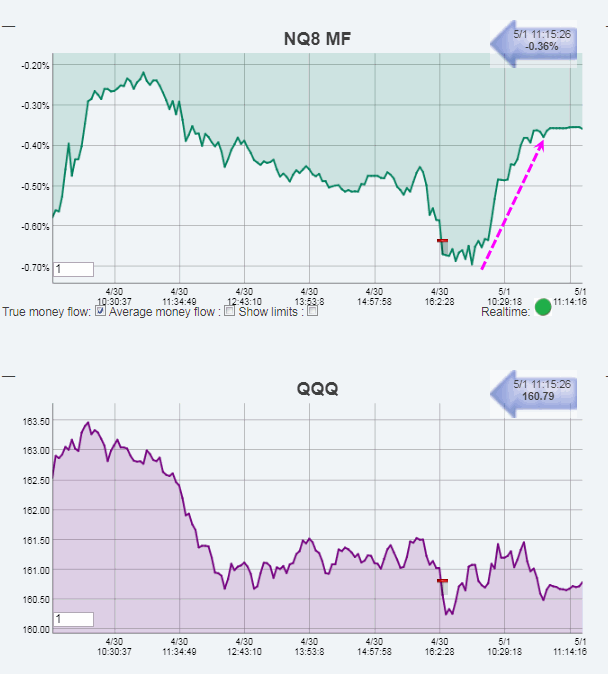
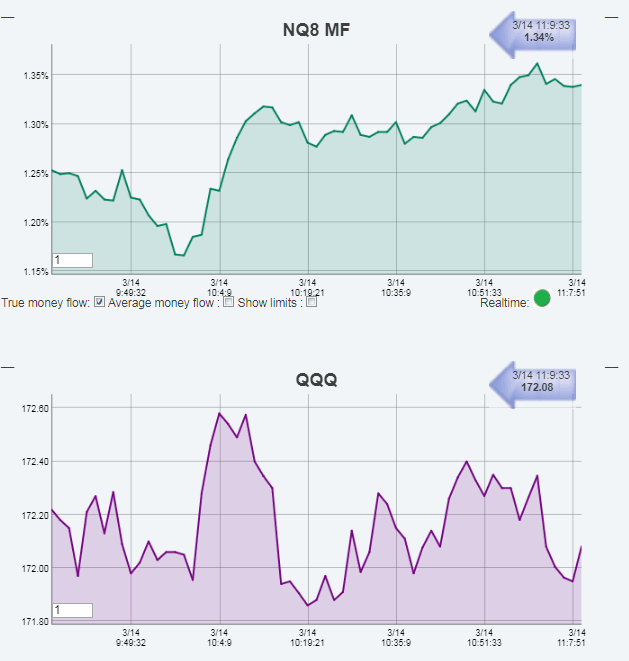
    There is speculative buying around AAPL, which triggered a positive Money Flow on the NQ8.

    For now, nobody really knows what AAPL will announce at the close. We could however get a relief rally tomorrow though.


    Pascal

    Name:  AAPL_EV.gif
Views: 2815
Size:  30.1 KBName:  NQ8_MF.gif
Views: 2761
Size:  33.2 KB

  3. #3
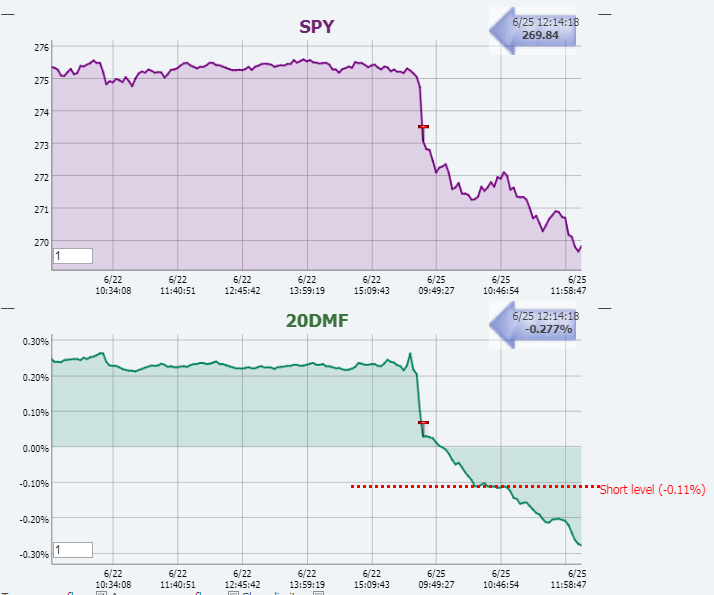
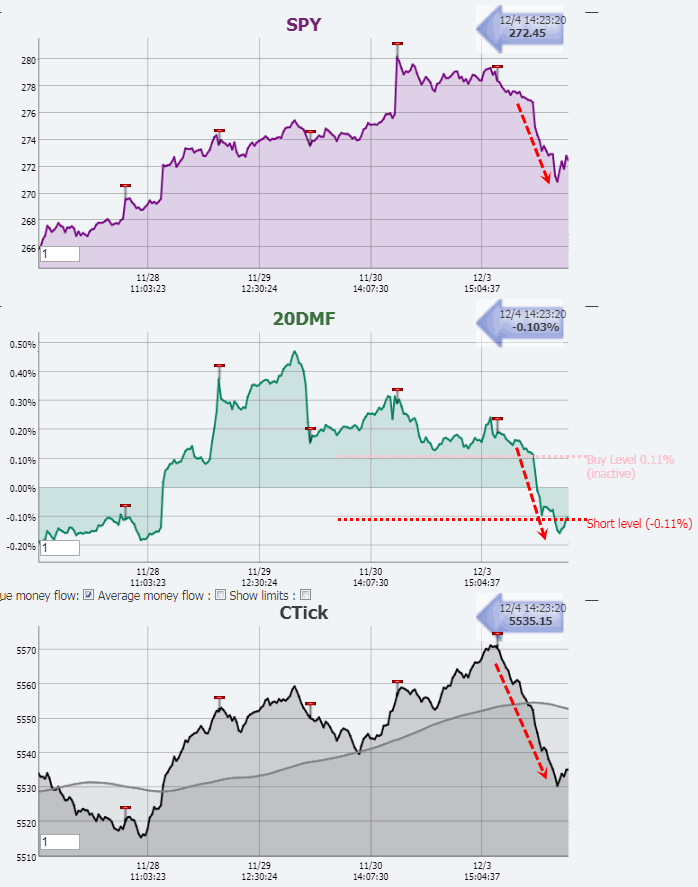
    Today we are in an everything-for-sale type of environment.
    The 20DMF turned short intraday.

    Pascal

    Name:  NQ8.gif
Views: 1498
Size:  29.8 KB

    Name:  Small Caps MF.gif
Views: 1458
Size:  30.5 KB

    Name:  20DMF_RT.gif
Views: 1450
Size:  29.8 KB

  4. #4
    Market is weak today, especially the small caps. No sign of a reversal, even though the NQ8 Money Flow is still above 0.


    Pascal

    Name:  NQ8_MF.gif
Views: 741
Size:  32.7 KB

    Name:  Small Caps.gif
Views: 729
Size:  33.3 KB

    Name:  20DMF_RT.gif
Views: 711
Size:  47.5 KB

  5. #5
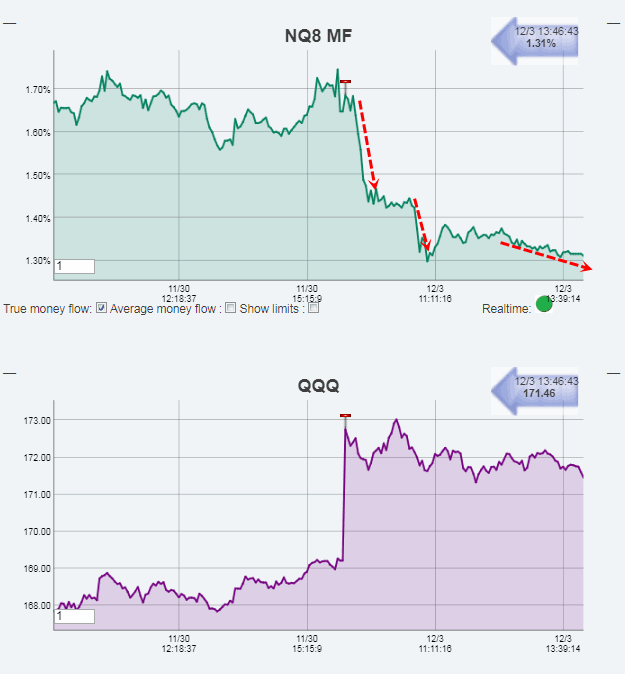
    No real conviction today. Is Santa Claus dead?

    Pascal

    Name:  NQ8_MF.gif
Views: 598
Size:  28.0 KB

  6. #6

    Weak market today

    Bounces are sold, but the NQ8 look stronger than the rest.

    Pascal

    Name:  20DMF_RT.gif
Views: 1740
Size:  43.6 KB

    Name:  Small Caps.gif
Views: 1727
Size:  31.3 KB

    Name:  NQ8_MF.gif
Views: 1713
Size:  30.5 KB

  7. #7
    Join Date
    Dec 1969
    Location
    Tarzana, CA
    Posts
    962
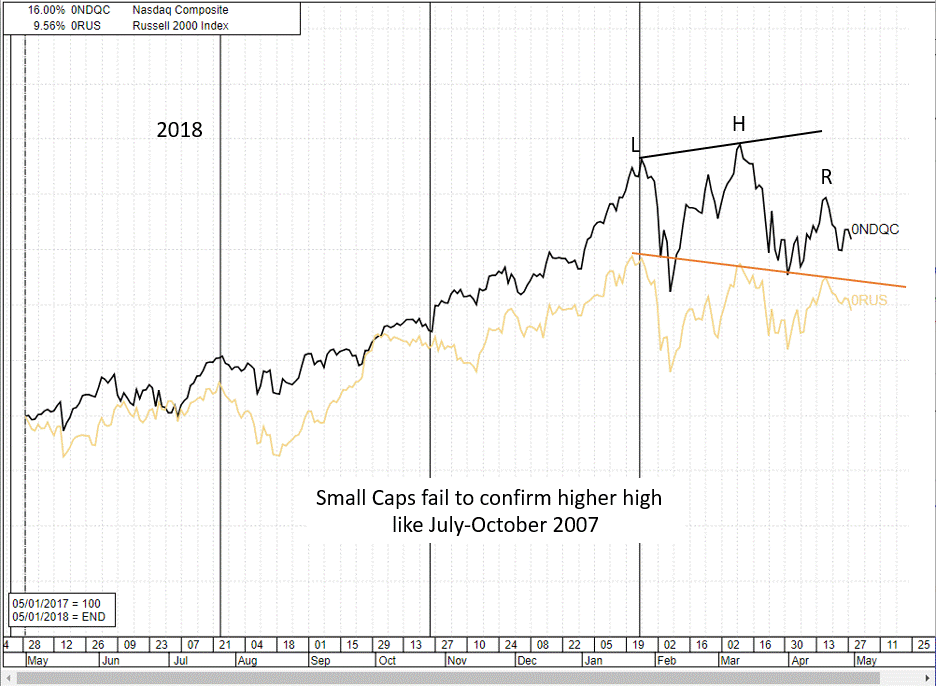
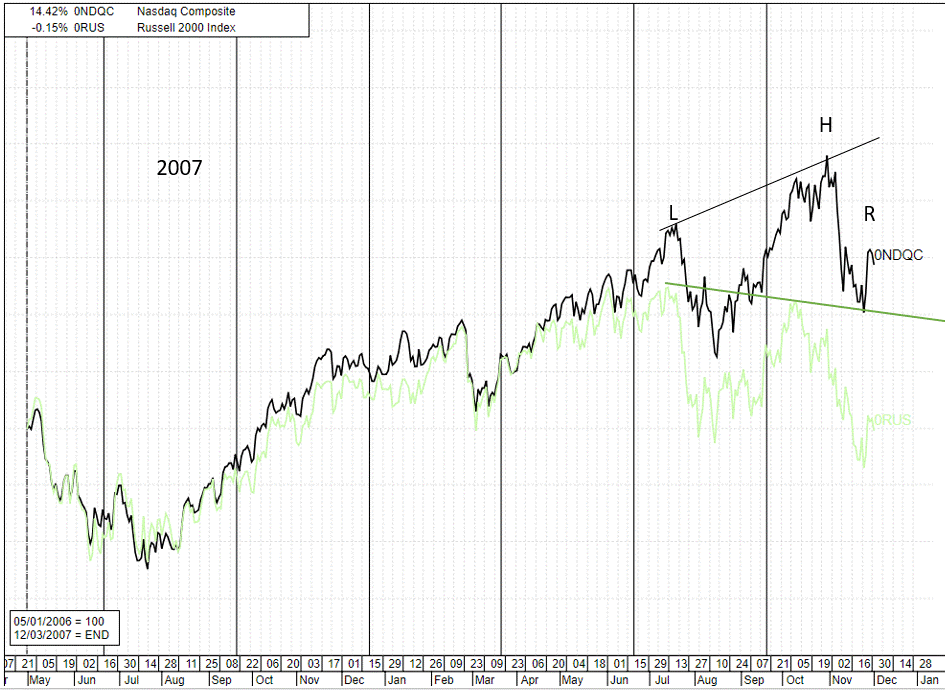
    These two charts are where my head is at relative to the overall market. I see similarities of the current market to the October 31, 2007 market top. In both images, the Russel 2000 fails to confirm the last NASDAQ higher high. At the time in 2007, I thought July was the top, then Bernanke gave us a surprise 0.5% rate cut on September, 18. The market zoomed into a blow-off top, where I was surer of the top.
    Name:  2018 Market.gif
Views: 2763
Size:  93.0 KB
    Name:  2007 Market.gif
Views: 2778
Size:  117.7 KB

    For my market read to be correct, a recession would logically need to be close by. This article by John Mauldin is a good read and it explores this possibility. http://www.mauldineconomics.com/fron...y-with-a-fever

    In 2007, we had a very major market top (larger head and shoulders pattern) where the NASDAQ dropped 55.7% over the course of 17 months. Both 2007 and 2018 are showing head and shoulders patterns. The 2018 pattern looks smaller to me, possibly implying less than a "bone-cruncher" type bear market of 2007-2009, maybe only half as large.

    Of course, every bearish call of the last few years have led to the market making new highs.
    Mike Scott
    Cloverdale, CA
  8. #8
    Activity is slightly positive today, but not impressive.


    Pascal

    Name:  NQ8_MF.gif
Views: 1480
Size:  33.7 KB

    Name:  20DMF_RT.gif
Views: 1474
Size:  44.8 KB

  9. #9
    The gap up does not seem to attract buyers. I guess that not many traders want to be long/exposed over the week end.

    Pascal

    Name:  NQ100.gif
Views: 703
Size:  34.6 KB

    Name:  20DMF_RT.gif
Views: 713
Size:  45.2 KB

  10. #10
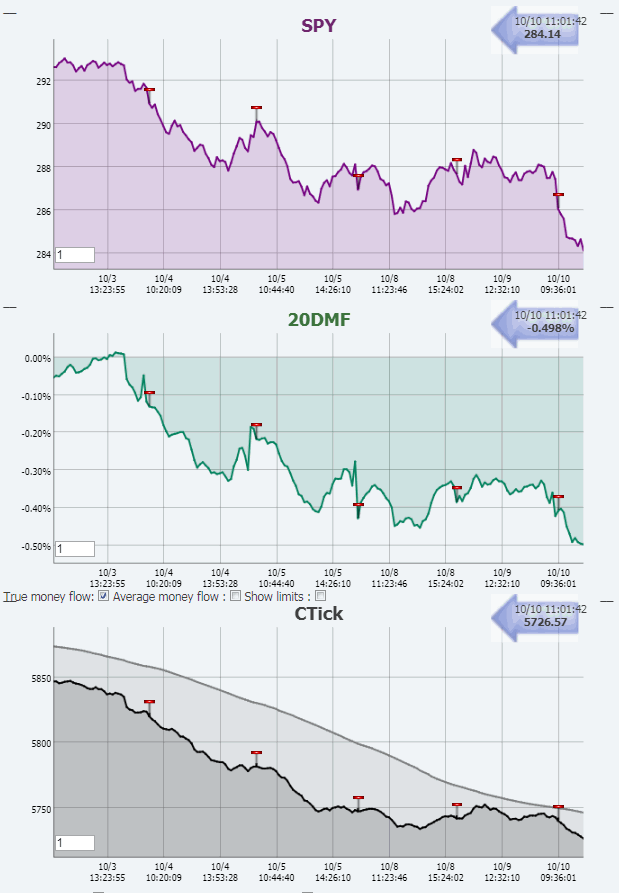
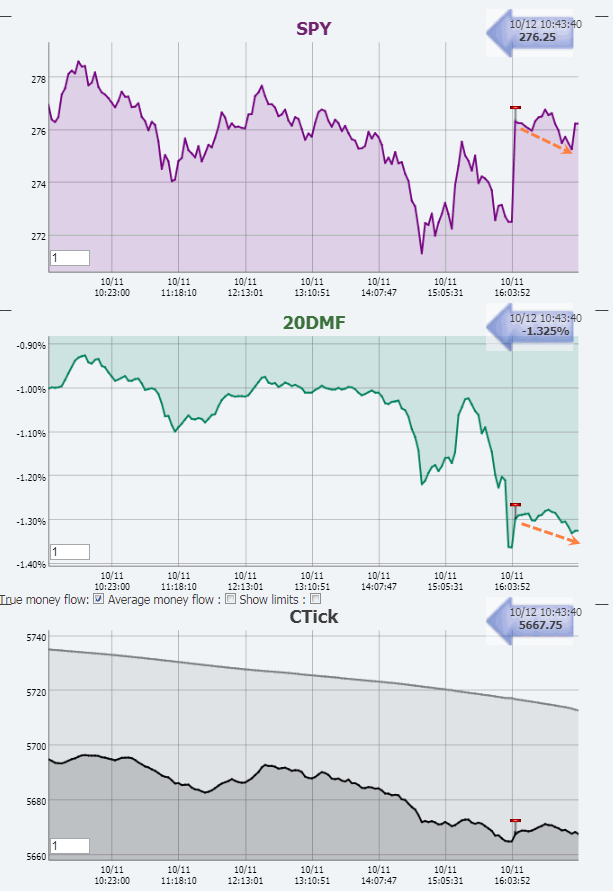
    Very poor market today. The 20DMF is about to issue a short signal.


    Pascal

    Name:  20DMF_RT.gif
Views: 580
Size:  43.6 KB

+ Reply to Thread

Posting Permissions

  • You may not post new threads
  • You may not post replies
  • You may not post attachments
  • You may not edit your posts