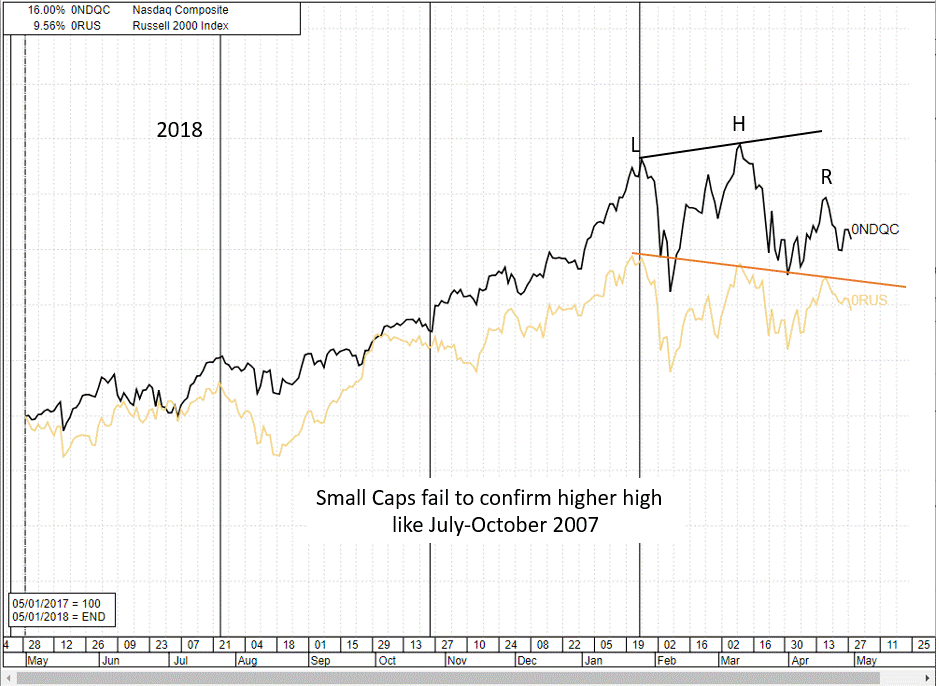
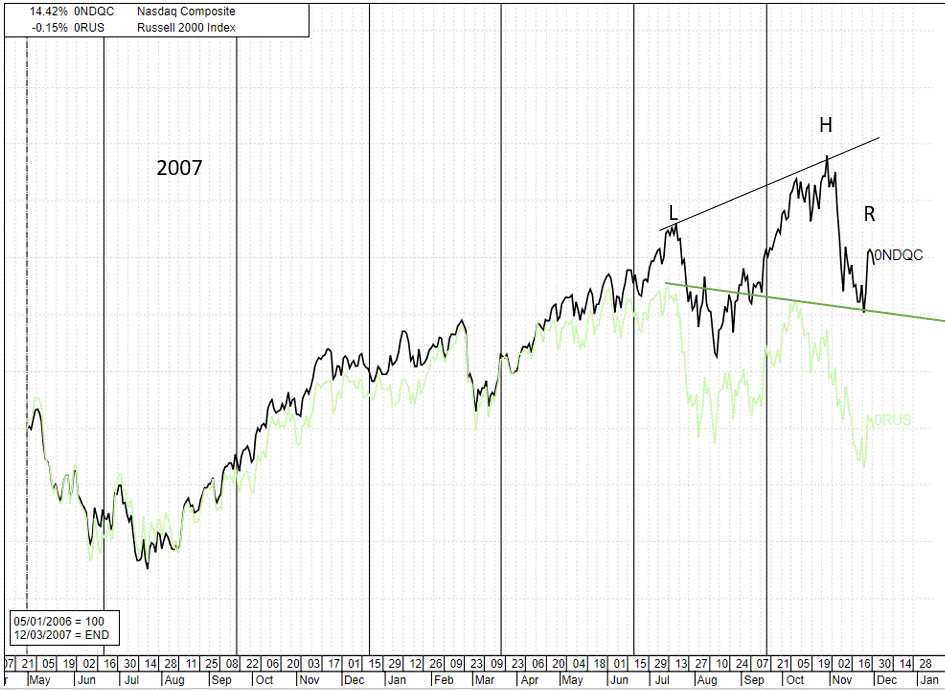
These two charts are where my head is at relative to the overall market. I see similarities of the current market to the October 31, 2007 market top. In both images, the Russel 2000 fails to confirm the last NASDAQ higher high. At the time in 2007, I thought July was the top, then Bernanke gave us a surprise 0.5% rate cut on September, 18. The market zoomed into a blow-off top, where I was surer of the top.


For my market read to be correct, a recession would logically need to be close by. This article by John Mauldin is a good read and it explores this possibility. http://www.mauldineconomics.com/fron...y-with-a-fever
In 2007, we had a very major market top (larger head and shoulders pattern) where the NASDAQ dropped 55.7% over the course of 17 months. Both 2007 and 2018 are showing head and shoulders patterns. The 2018 pattern looks smaller to me, possibly implying less than a "bone-cruncher" type bear market of 2007-2009, maybe only half as large.
Of course, every bearish call of the last few years have led to the market making new highs.
Mike Scott
Cloverdale, CA


 Reply With Quote