+ Reply to Thread
Results 1 to 10 of 85

Thread: Market

Hybrid View

  1. #1

    Weak market today

    Bounces are sold, but the NQ8 look stronger than the rest.

    Pascal

    Name:  20DMF_RT.gif
Views: 1702
Size:  43.6 KB

    Name:  Small Caps.gif
Views: 1690
Size:  31.3 KB

    Name:  NQ8_MF.gif
Views: 1671
Size:  30.5 KB

  2. #2
    Join Date
    Dec 1969
    Location
    Tarzana, CA
    Posts
    962
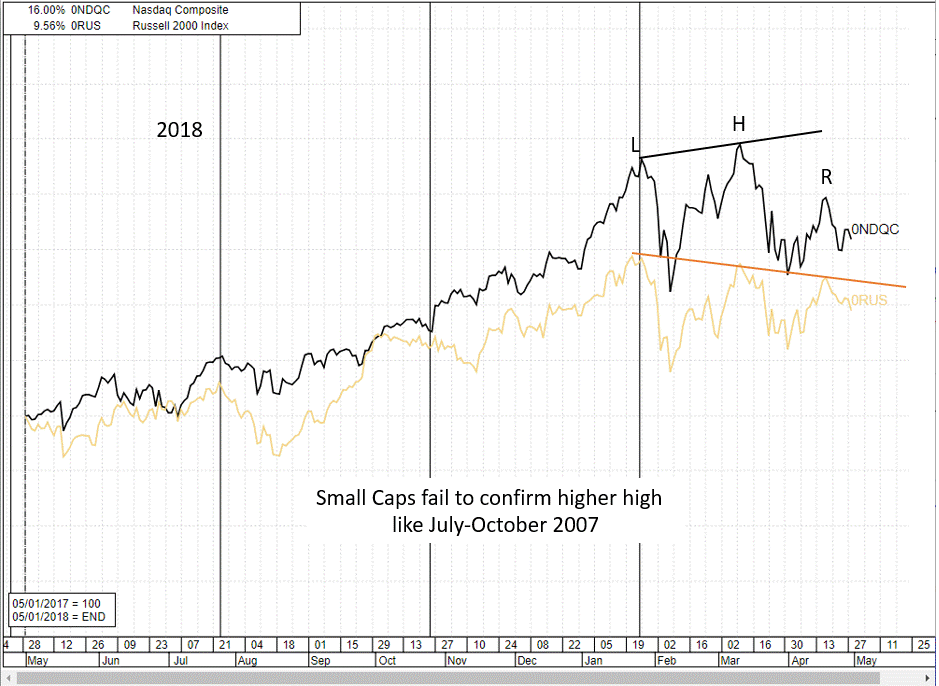
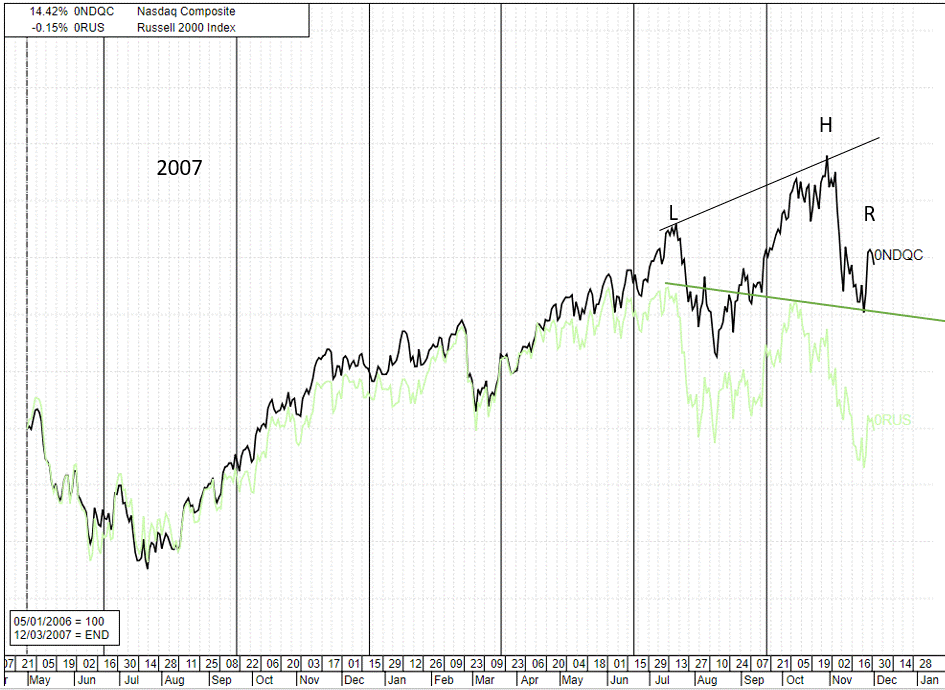
    These two charts are where my head is at relative to the overall market. I see similarities of the current market to the October 31, 2007 market top. In both images, the Russel 2000 fails to confirm the last NASDAQ higher high. At the time in 2007, I thought July was the top, then Bernanke gave us a surprise 0.5% rate cut on September, 18. The market zoomed into a blow-off top, where I was surer of the top.
    Name:  2018 Market.gif
Views: 2696
Size:  93.0 KB
    Name:  2007 Market.gif
Views: 2722
Size:  117.7 KB

    For my market read to be correct, a recession would logically need to be close by. This article by John Mauldin is a good read and it explores this possibility. http://www.mauldineconomics.com/fron...y-with-a-fever

    In 2007, we had a very major market top (larger head and shoulders pattern) where the NASDAQ dropped 55.7% over the course of 17 months. Both 2007 and 2018 are showing head and shoulders patterns. The 2018 pattern looks smaller to me, possibly implying less than a "bone-cruncher" type bear market of 2007-2009, maybe only half as large.

    Of course, every bearish call of the last few years have led to the market making new highs.
    Mike Scott
    Cloverdale, CA
  3. #3
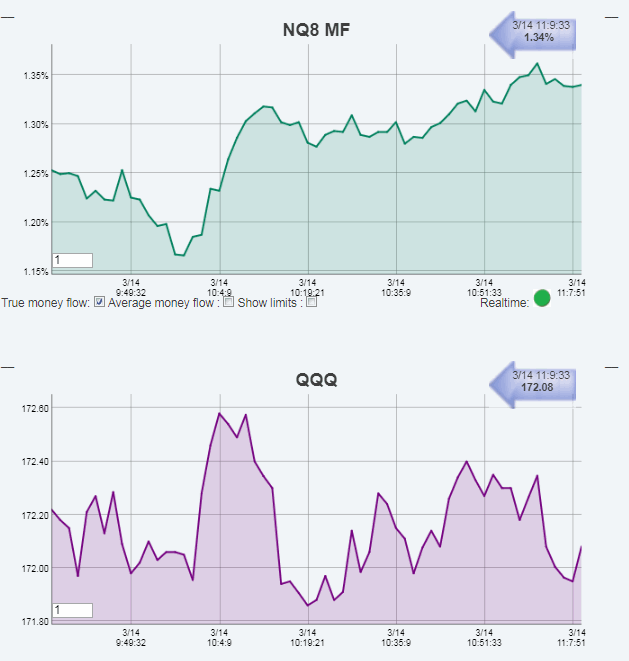
    Activity is slightly positive today, but not impressive.


    Pascal

    Name:  NQ8_MF.gif
Views: 1451
Size:  33.7 KB

    Name:  20DMF_RT.gif
Views: 1439
Size:  44.8 KB

  4. #4
    The gap up does not seem to attract buyers. I guess that not many traders want to be long/exposed over the week end.

    Pascal

    Name:  NQ100.gif
Views: 693
Size:  34.6 KB

    Name:  20DMF_RT.gif
Views: 697
Size:  45.2 KB

  5. #5
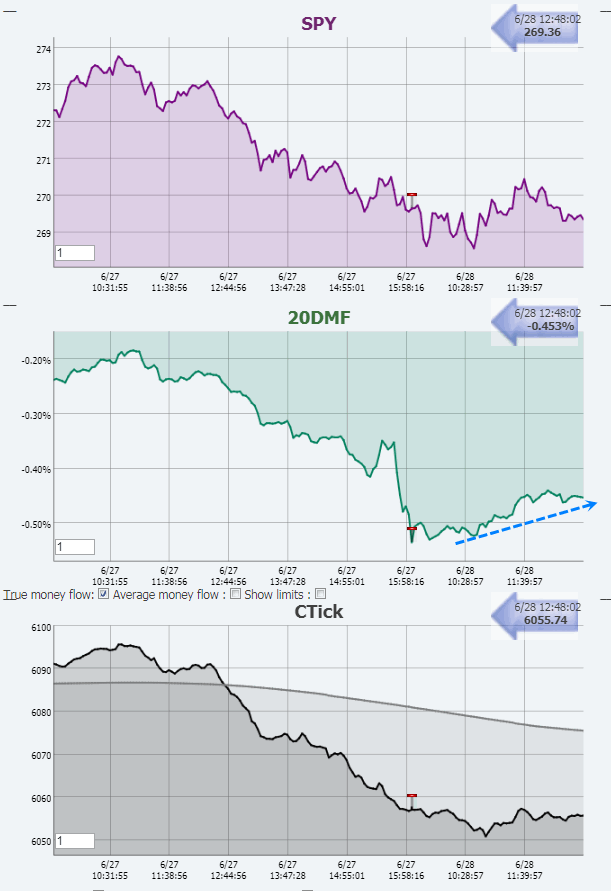
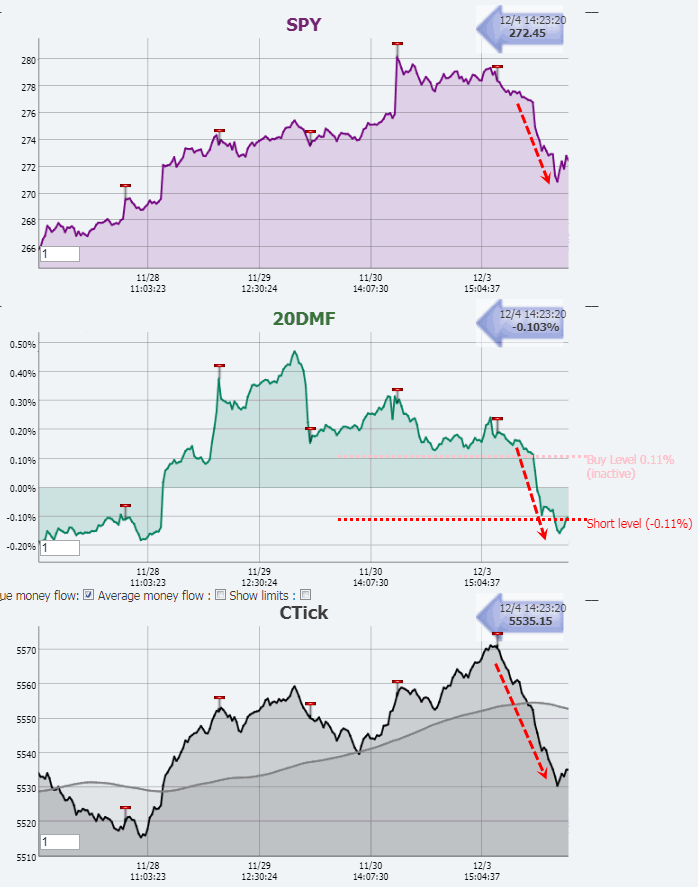
    Very poor market today. The 20DMF is about to issue a short signal.


    Pascal

    Name:  20DMF_RT.gif
Views: 549
Size:  43.6 KB

  6. #6
    Today's weakness is being bought.


    Pascal

    Name:  20DMF.gif
Views: 580
Size:  29.7 KB

  7. #7
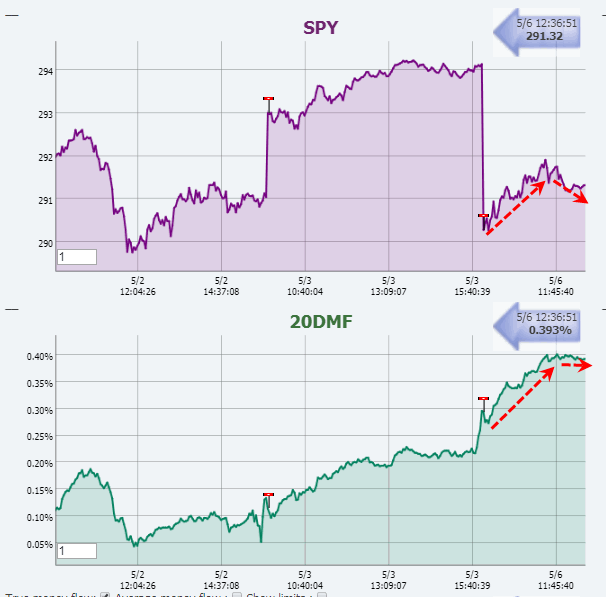
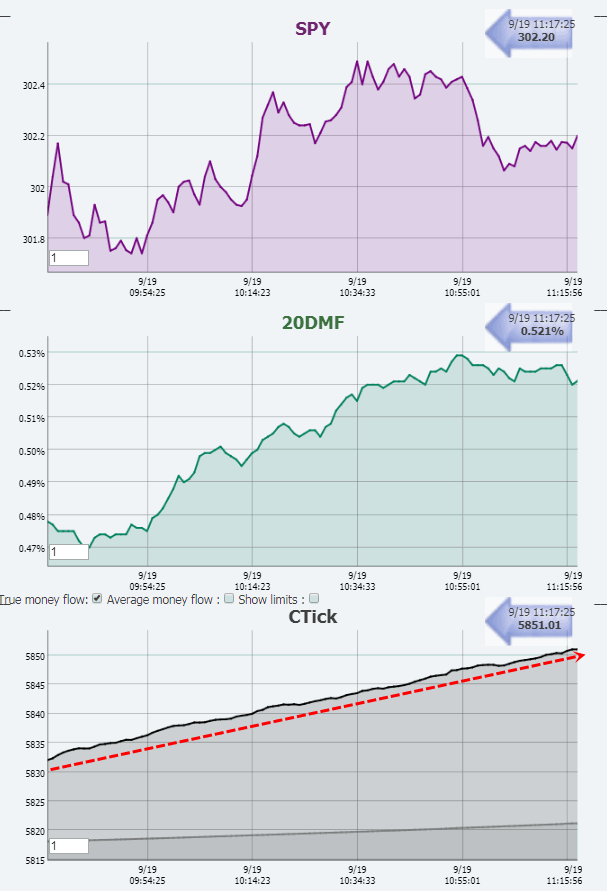
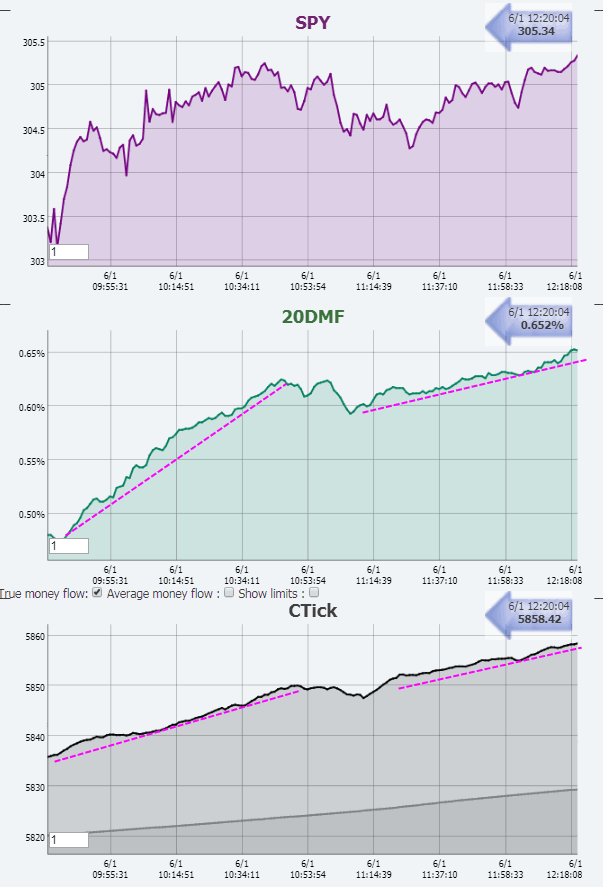
    Accumulation going in a straight line.
    Machines working.


    Pascal

    Name:  20DMF_RT.gif
Views: 668
Size:  39.5 KB

  8. #8
    Still money moving in the equities markets today.

    Pascal

    Name:  20DMF_RT.gif
Views: 879
Size:  32.5 KB

  9. #9
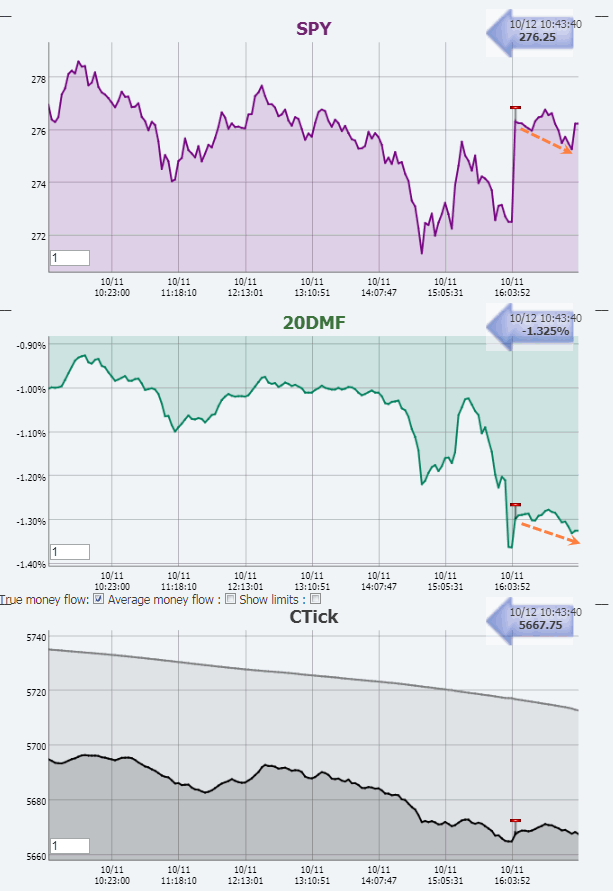
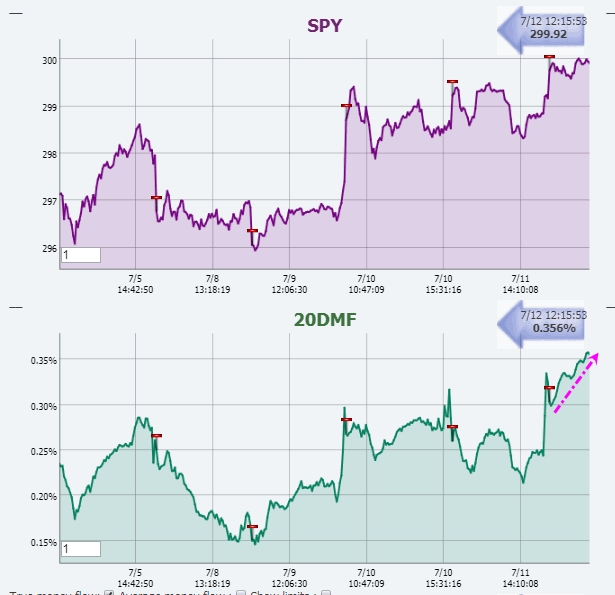
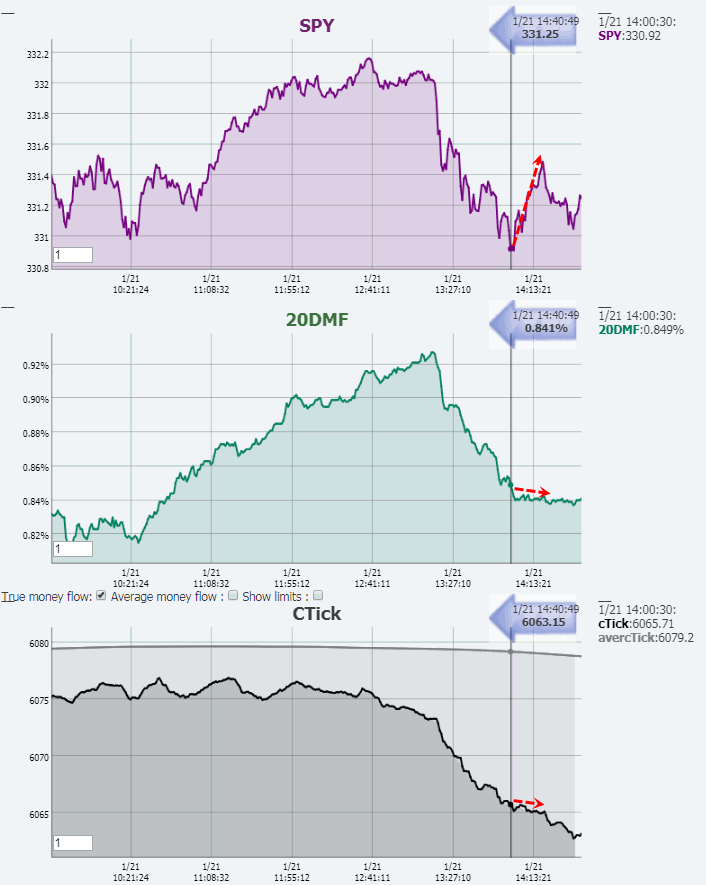
    It does not look good when the market bounces without large players supporting the bounce.


    Pascal

    Name:  20DMF_RT.gif
Views: 1446
Size:  48.4 KB

  10. #10
    I feel somewhat uneasy to see some almost linear accumulative Money Flow. It is as if a money printing machine was directly attached to the market.

    This is certainly not the type of pattern that retail investors will generate.
    It is a pattern that is generated by funny money that is closely followed by index investors (ETFs) and large funds. Nothing scientific or linked to value here.

    Pascal

    Name:  Small Caps MF.gif
Views: 3718
Size:  33.7 KBName:  20DMF_RT.gif
Views: 3782
Size:  43.8 KB

+ Reply to Thread

Posting Permissions

  • You may not post new threads
  • You may not post replies
  • You may not post attachments
  • You may not edit your posts