Welcome to The Effective Volume Web site!
This web site was started in 2008 as a way to continue the Effective Volume research work that was published in the "Value in Time" Book (Wiley 2008). Early in 2009, I developed and started to publish here the 20DMF, a sector based market direction model (see more explanation below).
The Market Direction Model
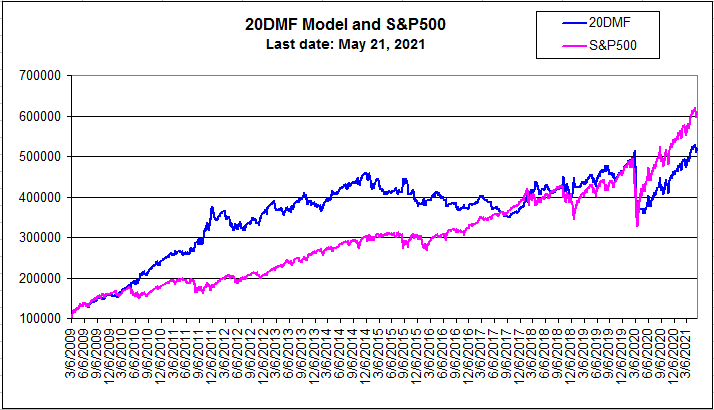
The 20DMF is a broad market direction model. The End of Day trades can be accessed through the 20DMF page, while the real-time trades can be accessed through the trading models section.
In December 2012, following the results of the study published below and after more than one year of testing the 20DMF RT using the "Cumulative Tick confirmation" and the "Forced Buy" rules, we decided to integrate these rules to the 20DMF EOD.
http://www.effectivevolume.com/conte...0DMF-Revisited
On August 4, 2014, I published the following Article that refines the Oversold signals on the 20DMF.
This improvement started to be applied right away.
http://www.effectivevolume.com/conte...-August-4-2014
We can see in green the 20DMF returns since 2009 using this improved method, compared to the earlier 20DMF Model that is shown in blue. Although both outperformed the S&P500, the green model is better at capturing the S&P500.
 Daily Market Comments
Daily market comments are available to subscribers of the EV database.
Daily comments archives are available to all registers users. Registration is free.
How this web site is organized
When investing, I find it easier to go with the general market trend. We select sectors that are ready to move, before choosing individual stocks.
Therefore, this is how this web site is organized:
- A) a general market section
- B) a comparative Sectors/Sub-Sectors Analysis
- C) of individual stocks within the Sector
Sector cycles: follow the money
Any sector goes through cycles of price changes that are dictated by the investment cycles of institutional players. Institutional players indeed reallocate funds on a regular basis. By doing so, they change the supply/demand equilibrium, which may provoke a price change. Because institutional investors need much time to change their positions, aside from market crashes, market trend changes take many days to happen and require a constant stream of dedicated selling or buying waves. The major part of my work has been to try to detect supply/demand imbalances in the market, in sectors and then in specific stocks. When I study either the price cycle or money flow (MF) cycle of a sector, I only look at the momentum of a value, because it catches the underlying change quicker than following the value itself. This momentum is usually called the "Rate of Change" or "ROC".I often noticed that the Money Flow ROC has a cycle change that occurs before the price ROC. To me, it is a sign that the change in the supply/demand equilibrium takes some time to show up in the price. It needs quite a large and dedicated move by institutional investors for a sector to reverse its price trend. To trade with the waves of supply/demand is, I believe, critical to one's trading success. It is as critical as the need to perform good fundamental analysis. When the Money Flow ROC is at its top, it does not mean that the price is going to drop soon. It simply means that institutional investors are at their highest accumulation momentum. At this point, the price still has quite a fair amount of room to move up.Comparatively, when the Money Flow ROC is at its lowest point, it means that institutional investors are heavy sellers. At this point, if the price cycle is at its highest, it will have great difficulties still moving higher (except if new institutional investors come in and buy more stock).
I invite you to move to the sectors section to see how the cycle comparison works.
The principle of investing through Effective Volume
The Effective Volume method is based on the hypothesis that because institutional investors have to take large positions in stocks - in order for them to be able to make money - they need to be very cautious as not to induce price changes while they are still busy accumulating or distributing shares. They therefore use sophisticated software programs that drip-release orders on the market. The regularity of such orders will respond to the liquidity variations that appear on the other side of the market. The market is therefore in constant search of equilibrium. Everybody knows about price breakouts that attract new buyers whose buying fuels the new price trend. What is less well known, however, is that clever funds accumulate their positions before a breakout. While accumulating shares, these funds provoke some microscopic but regular demand/supply imbalances. By studying the price changes at regular small periods of time (one-minute intervals) and by relating these changes to the size of the transactions that provoked the changes, it is possible to detect constant buying or selling patterns. Moreover, when I separate the volume responsible for price changes into two groups (large and small) and then track the large player's group, I notice that this group is responsible for 75% of all the price changes that occurred from one minute to the next. Investing when large players are heavily investing in a stock is a very good method, but only when the stock price is finding a bottom within a long up-trend.
Please, feel free to enter a three months $50 subscription to the EV signals - See the subscription section.
A full refund will be processed if the subscription is canceled within 30 days. To cancel, simply send an email to : info(at)effectivevolume(dot)com
The weaknesses of the Effective Volume method
A first weakness of the method is that, when you only follow the Effective Volume signal, you start to have a tendency to trade against a price trend. The method works best when the price is within a trading range. It may not be used when the price is trending down, because the large Effective Volume method does not distinguish between short covering activities and new long positions.
A second weakness is that the Effective Volume method does not take into account parallel trading activities such as ETFs and options. It is indeed possible that a large fund takes a long position in options while shorting the stock, trying to profit from the difference in volatility. This would show up as a downward pressure on the Effective Volume pattern, while in reality the move should have been neutral. The solution is to look at longer time frames (40 days accumulation patterns in Effective Volume) or to compare moves on others stocks in the same sector.
Disclaimer
Signals are provided as general information and are not investment recommendations. You are responsible for your own investment decisions. Past performance does not guarantee future performance. Opinions are based on historical research and data believed reliable. There is no guarantee that your results will be profitable. I am not responsible for errors or omissions. I may invest in the vehicles mentioned above.
If you have questions, do not hesitate to contact me: info(at)effectivevolume(dot)com
Effective Volume is a European Union and US Trademark and Service Mark.
The Effective Volume software that is available in the "Software" section falls under the Product Trademark registration.
The daily updates of the Effective Volume graphs and data, as well as the information found on the "Reports" section offer to traders a timely access to data calculated using the Effective Volume method and software fall under the Service Mark registration.


