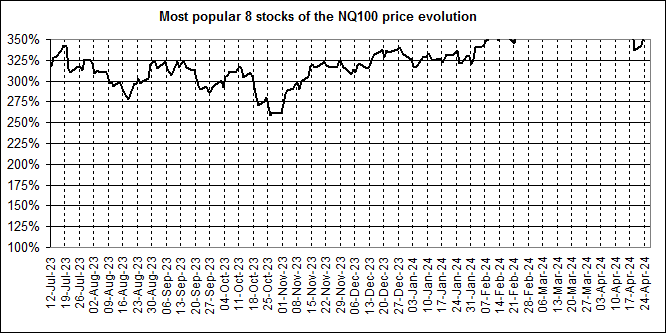
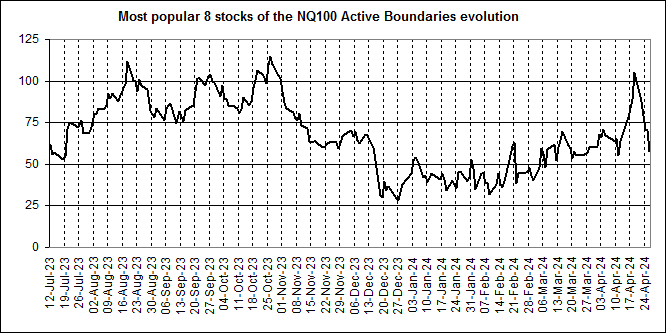
The Active Boundaries is an indicator that allows to rate the valuation of a stock compared to its current price trend. When a stock pulls back down to the bottom of its trend, it is rated as cheap and gets an Active Boundaries (AB) rate that is high. Usually, AB higher than 100 indicates stocks that are at a good entry price.
When a stock is close to the top of its trend, it gets a low AB rating because upside is limited either in price or in time.
I have plotted below the weighted average AB indicator for the NQ8 stocks that have been market leaders. Data only dates back to July 2012. This means that this indicator only measures part of the current bull market and is not a good long-term indicator.
We can see below the Green arrows that point to short signals: when the average AB crosses above the 25 level. The Red arrows point to buy signals when the AB indicator crosses below the 110 value.
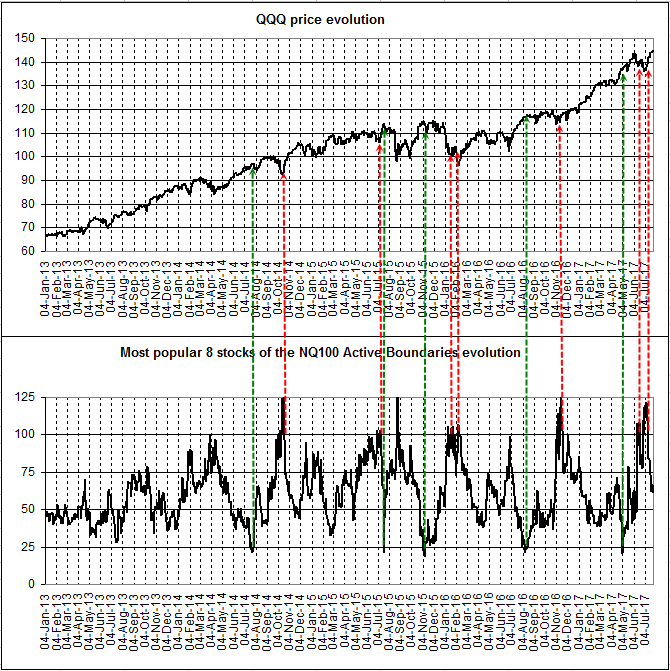
The results are below and as expected, trading long the QQQ on Buy signals did better than the benchmark, while trading short the QQQ on short signals produced a negative return (Which is good for short trades)
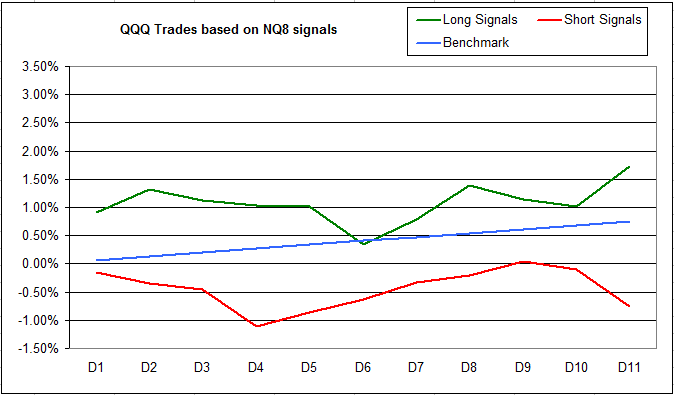
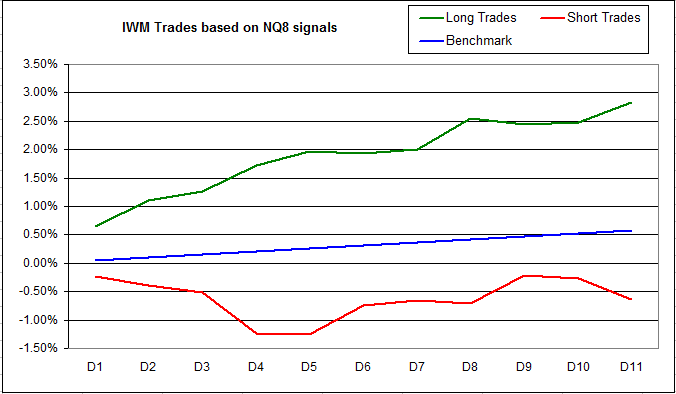
The interesting part of the study however lies below: we can see that on Buy signal issued by the NQ8 AB indicator, small caps did much better than the QQQ itself. this points to strong shorts covering rallies.
In other words, the best is to buy the small caps when a NQ8 AB signal is issued.
