The Volume Trigger Alert system produces potential buy signals on stocks making a move up in price on significant volume. The list of stocks scanned by this system is filled with growth stocks with good pedigree as measured by earnings growth, sales growth and profit margins as well as good price performance. The focus on these high pedigree stocks is specifically to generate trading opportunities that are profitable on the medium to long term with expected holding periods of weeks to months to years. Thus we are using a short term signal to enter a stock at a high probability entry position. Each weekend a new list of prospective stocks is generated. This list in general will number in the range of 50-100 stocks. At the market open every day a website will show the status of every stock alerting users to those stocks that meet a specific criteria.
A volume trigger alert system scans the list of stocks for conditions as follows:
- Price change greater than 0 and,
- Price above 50-day simple moving average and,
- Price less than 4% above 50-day moving average, or
a. Price above 10-day simple moving average and,
b. Price less than 4% above 10-day moving average and,
- End of day volume greater than any down-day-volume exhibited during the prior ten trading days
Primarily these conditions are testing for a buyable set up coming from two conditions. The primary condition comes from a stock that is testing its 50-day moving average either in a pull back to the 50-day or after being in a correction regaining the 50-day on the right side of its price consolidation. The alert trigger system gives an objective measure whether institutional volume is behind the move giving the private investor confidence to move in. The secondary condition is a follow-on buying situation where it has been shown that a stock pulling back to the 10-day moving average or moving up through it provides a similarly low risk entry area.
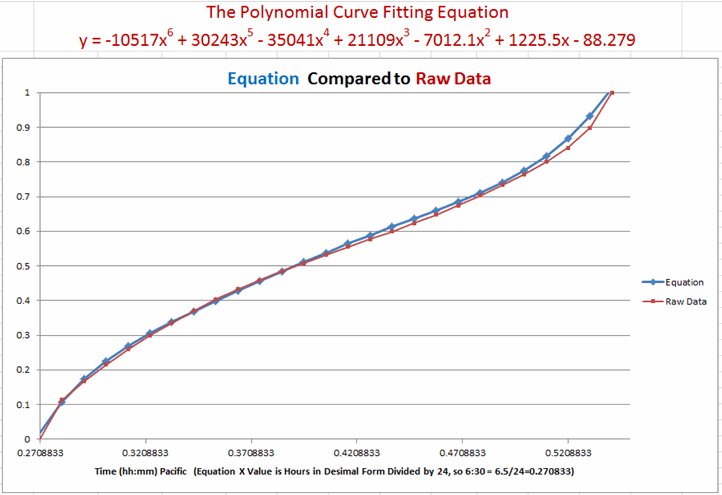
The conditions above are for end-of-day price and volume. In order to provide timely alerts Intraday, End-of-Day (EOD) volume is extrapolated using intra-day total volume. A 6th order polynomial extrapolation equation has been developed from observations of total intraday volume on the NASDAQ. The curve below shows the nonlinear nature of volume during the trading day where the heaviest volume occurs at the start and end of the trading day. The polynomial is used in real time on every stock on the watch list to extrapolate to end-of-day.

An issue arises from estimating end of day conditions from intraday data: how accurately will the predicted end of day conditions represent the achieved values at end of day? In general the volume of an individual stock tends to follow the same pattern as the general market and the extrapolation equation has been used for several years with success. However, early in the trading day the estimation errors are larger. A method has been developed to measure the quality of the alert that takes into account the magnitude of volume compared to the minimum threshold to generate an alert as well as the amount of volume remaining to achieve 100% of end-of-day volume. The first factor is called Volume Trigger Margin%. And the second value is incorporated into a factor called Quality%.
Quality% = Volume Trigger Margin%/Volume% Remaining
Volume% remaining is 100% - current estimated EOD volume%. When the Quality ratio reaches 70% it is estimated that the EOD volume estimate is high enough to persist into the end of the trading day. In practice when volume is very high these alerts can come in the first half hour of the trading day. Minimal trigger volume margins take longer to generate an alert. The full subscription service sends out emails when an alert condition is reached. The following section describes the web based service.
Stock symbols are in the left-most column. Stocks that are generating a volume trigger alert will have their row colored in green as WUBA is in this image. Pascal Willain’s Supply Indicator and Large Effective Volume (LER) indicator are in columns 2 and 3. These will not be discussed here other than to say that large LER (>100) and small Supply (<10) generally correlates with longer term trading opportunities. Column 4 is the time of last data update, the page automatically refreshes once per minute. Current volume, current close price and price change from yesterday’s close are in columns 5, 6 and 7.
Columns 8 and 9 show the percent above the 50-day moving average and 10-day moving average respectively. These values are pertinent to the trading opportunity as only prices close to the moving averages should be considered proper. The word “Above” or “Below” appears in this column if the current close price is not in the range of 0% to 5% above their respective moving averages. Once a possibly trading opportunity develops users should check a stock chart.
Column 10 is the calculated EOD volume and column 11 shows the threshold volume which is equal to the largest volume that occurred during the last 10 days on a down day.
Column 12 is one of the most important columns. It shows how much measured in percent todays extrapolated EOD volume is above the threshold volume, the larger the value the better the opportunity.
Column 13 is the Quality measure discussed previously. Quality above 70 will generate an email alert if all of the other parameters for an alert.
Column 14 is closing range. It represents where in the range of prices from intraday low to intraday high the current close is. Thus if the close is at the top the range will be 100% and if at the bottom it will be 0%. Ranges above 50% are constructive.
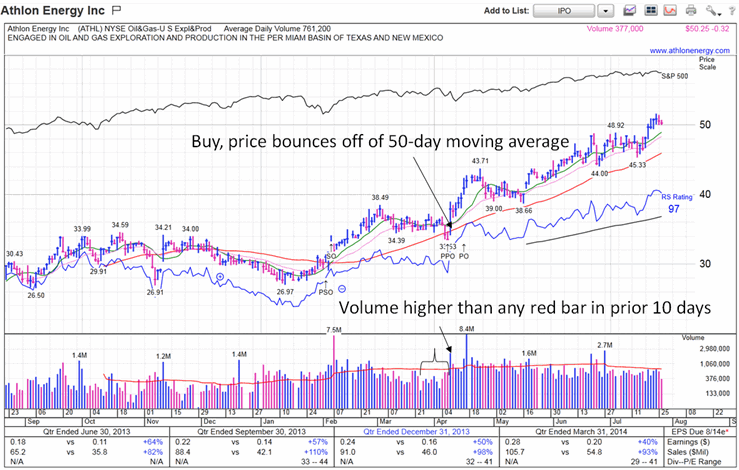
Here is a past set up on ATHL. Notice that ATHL pulls back to just below the 50-day moving average and then briskly makes a move up off of the 50-day. Because of the high volume this would have been a high Quality opportunity with an alert early in the trading day.

Users are encouraged to use this new facility and ask questions. Feedback on features is desired in the Mike's forum or by leaving a comment on this page.

