The Real-Time EV
List of services and their related Video links
| Service |
Video |
| The 20DMF in Real Time |
|
| The XLX Models |
|
| The Real Time Effective Volume |
|
| My Stocks |
|
| The Supply Indicator |
|
| The Volume Surge |
|
Readers of this web site know how to use Effective Volume, but a reminder is posted here:
LEV_SEV_Overview.pdf
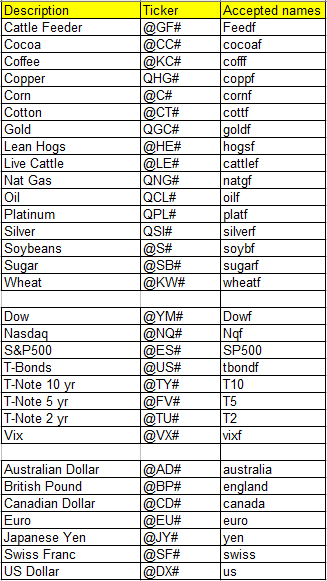
Below is a list of the most popular tickers for the Futures.
 The Supply Indicator
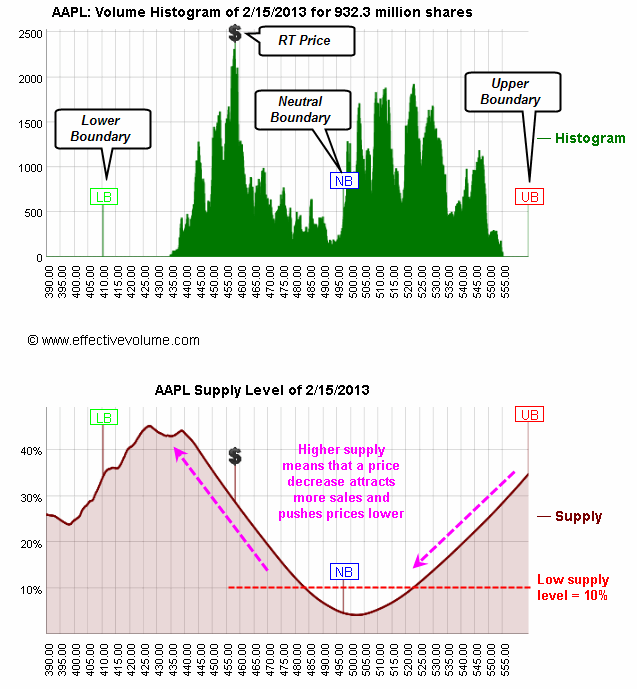
The Supply Indicator is a mathematical model that calculates the probability that a shareholder will sell his or her shares. The primary reasons why shareholders sell shares are to take profits or to cut losses (to avoid later larger losses by quickly selling at a small loss.)
The model's main hypothesis is that the propensity to sell a losing stock is higher as the loss grows bigger, but at some point, when the paper loss is too big, shareholders are locked in and prefer to wait for a bounce.
The second hypothesis is that shareholders are quicker to sell a losing stock than a winning stock, but selling pressure on winning stocks will increase with an increase in the gain.
These principles are explained in Ch4 of the "Value In Time" book.
The Supply Indicator and the Volume Histogram figures show the patterns as of the previous day's close. They also display the boundaries' limits as of the previous day's close, while the price level is shown in real-time.


